Module fed3.plot
Plotting with fed3
Import fed3.plot
The plotting package within fed3, fed3.plot is not imported by default.
Make an explicit call to import it:
import fed3
import fed3.plot as fplot
For the purposes of this documentation, matplotlib will be used to set the default figure size.
import matplotlib.pyplot as plt

plt.rcParams['figure.figsize'] = [7, 5]
plt.rcParams['figure.dpi'] = 100
Example data
The following sections will make use of some example data, provided by the fed3.examples package:
feds = fed3.load_examples('justin', deduplicate_index='offset', offset='1s')
f = feds[0]
Basic plotting
The following section will intoduce the basics of plotting with fed3.
The "Hello World" plot
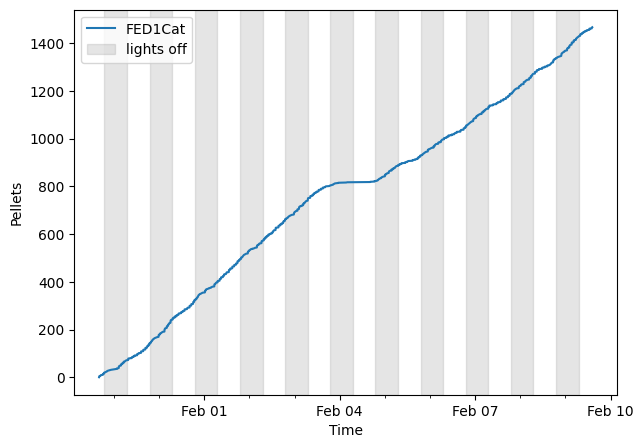
The simplest plot is the line plot, which plots a variable of interest over time.
This demonstrates the syntax that applies to almost all plotting functions: pass the data to be plotted as the first argument (the FEDFrame(s)) followed by any options.
In this case, the y parameter specifies the variable to be plotted:
fplot.line(f, y='pellets')

plt.show()
Many other y values can be specified - they link to the functions defined within fed3.metrics.
Call fed3.list_metrics() to see all available options.
Plotting multiple FEDs
Most plots are able to plot data from multiple FEDs, either as separate or aggregated curves. The structure of the passed data determines this behavior:
- A single FEDFrame (
fed3.core.fedframe.FEDFrame) specifies a single line to be plotted (as shown above) - A
list(or other 1D collection) of FEDFrames will plot each as separate curves - A
dictis used to aggregate data. Within each dictionary, the key is the group label, and the value is the collection of FEDFrames belonging to that group.
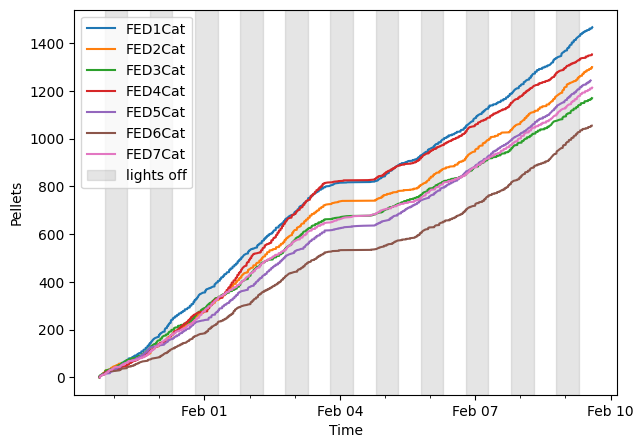
List of FEDs
The following is an example of the second option - data for each FED are plotted as individual lines.
fplot.line(feds, y='pellets')
plt.show()
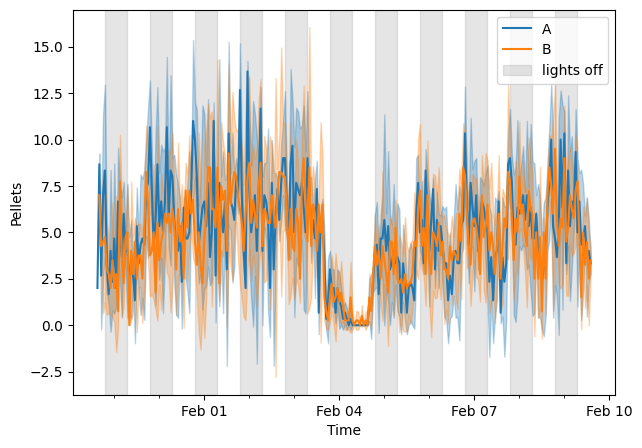
Grouping
To create a group average, pass a dictionary indicating group membership:
groups = {'A' : feds[0:3], 'B' : feds[3:]}

fplot.line(groups, y='pellets')
plt.show()
bp = feds[0]['Pellet_Count'].diff().copy()
feds[0].event_type(bp.index[0])
'Poke'
A few things have changed in the above plot:
- There are two curves plotted only; one for each member of the dictionary passed. The curves correspond to the average pellet retrieval, and the shaded error bar correspond to the standard deviation.
- The measure of pellet retrieval has changed from cumulative to absolute.
I.e., the y-axis corresponds to the number of pellets retrieved (on average) within each temporal bin (by default, 1 hour).
This is the default behavior of the
y='pellets'metric (see here).
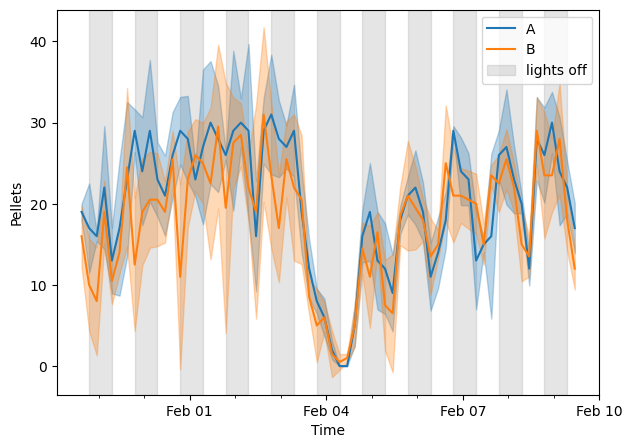
There are options to tweak the behavior for grouping.
agg sets the aggregation method for the grouped data, and var sets the measure of error.
Furthermore, the bins parameter sets the resolution of temporal averaging:
fplot.line(groups, y='pellets', bins='4H', agg='median')
plt.show()
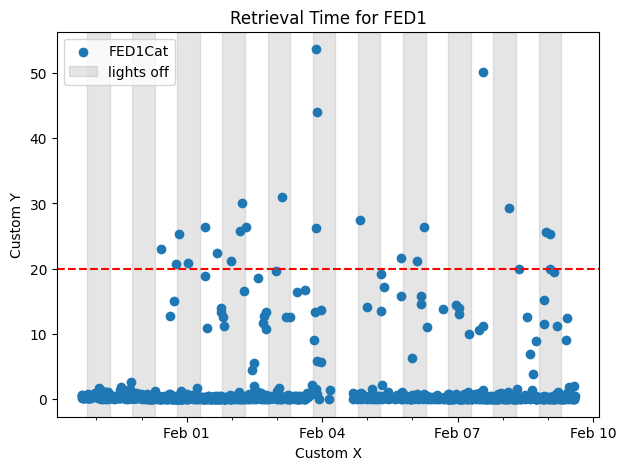
Integrating with matplotlib
Plotting with fed3 is all implemented through calls to matplotlib. Thus, you can make use of typical matplotlib routines to customize your plots:
import matplotlib.pyplot as plt

fplot.scatter(f, y='rt')

plt.title('Retrieval Time for FED1')
plt.xlabel('Custom X')
plt.ylabel('Custom Y')
plt.axhline(20, color='red', linestyle='dashed')

plt.show()
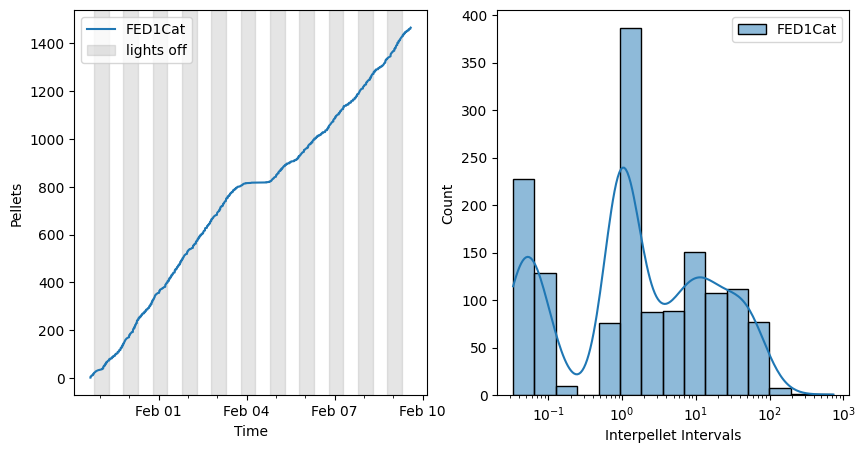
Most plots can also be directed to a given matplotlib axis, using the ax argument:
# create layout
fig, (ax1, ax2) = plt.subplots(nrows=1, ncols=2, figsize=(10, 5))

# plot
fplot.line(f, y='pellets', ax=ax1)
fplot.ipi(f, ax=ax2)
plt.show()
This can also be used to plot different metrics from one FED on the same axis:
# create figure and axis
fig = plt.figure()
ax = plt.subplot()

fplot.line(f, y='left_pokes', ax=ax, shadedark=False, label='Left')
fplot.line(f, y='right_pokes', ax=ax, label='Right')
plt.ylabel('Pokes')
plt.show()
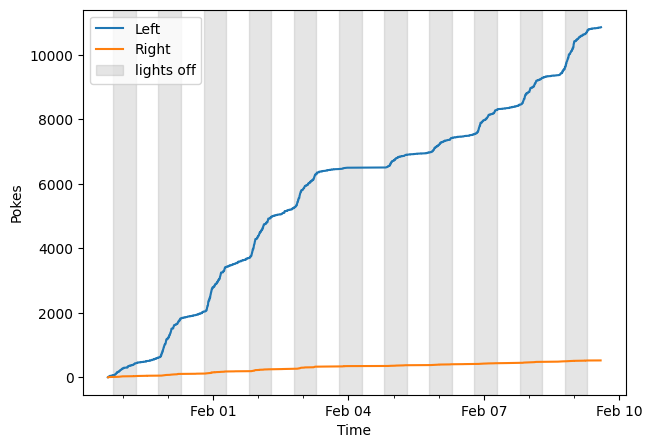
Note that above, shadedark=False is specified for the first plot to prevent the dark periods from being drawn twice.
An alternative to this is to set the default behavior to not draw dark periods.
This can be done by setting fed3.plot.OPTIONS['default_shadedark'] = False.
You can then "opt in" to shading the darkness with the fed3.plot.shadedark argument, or by calling shade_darkness().
There is also a similar option for the legend, fed3.plot.OPTIONS['default_legend'].
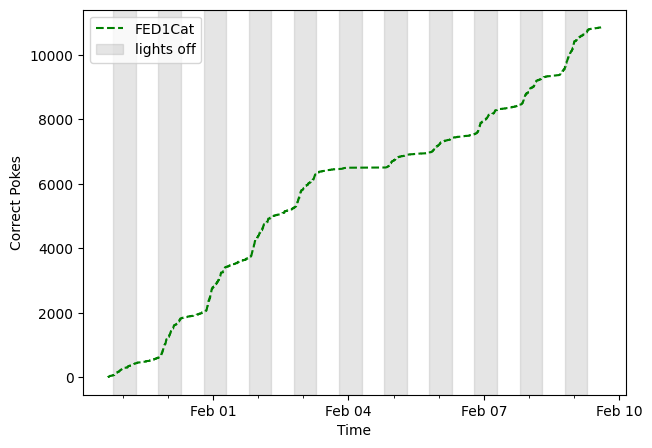
matplotlib keywords
Most plots also accept keyword arguments which are passed to drawing functions from matplotlib, allowing for more specific customizations.
For example, line() passes arguments to matplotlib.axes.Axes.plot:
fplot.line(f, y='correct_pokes', color='green', linestyle='dashed')
plt.show()
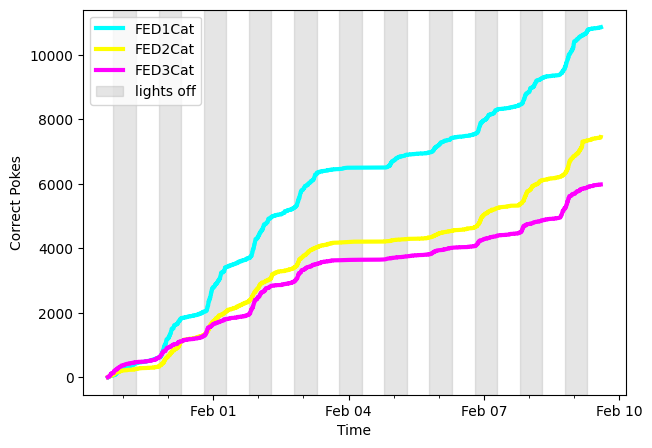
When plotting multiple FEDs, specifying a single value for a keyword argument applies it to all FEDs. To specify particular styles for particular FEDs, dictionaries can be used:
styles = {
    feds[0].name : {'color': 'cyan'},
    feds[1].name : {'color': 'yellow'},
    feds[2].name : {'color': 'magenta'}
}

fplot.line(feds[0:3], y='correct_pokes', lw=3, line_kwargs=styles)
plt.show()
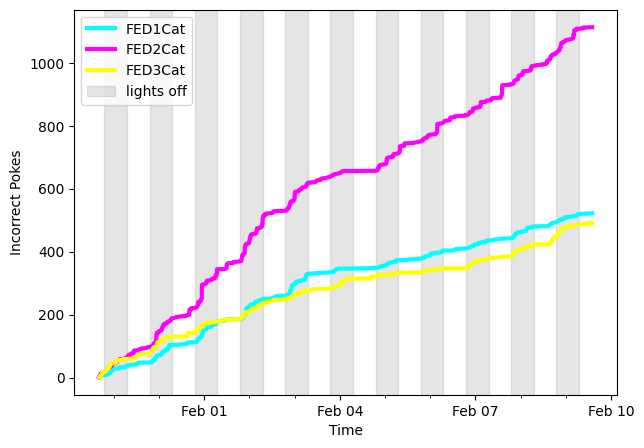
The above method can be somewhat cumbersome to setup.
One alternative that fed3 provides is the "argument helper", abbreviated with argh().
This can be used to pass a series of arguments to a series of curves being plotted.
To generate a similar plot as above, do:
fplot.line(feds[0:3], y='error_pokes', lw=3, color=fplot.argh(['cyan', 'magenta', 'yellow']))
plt.show()
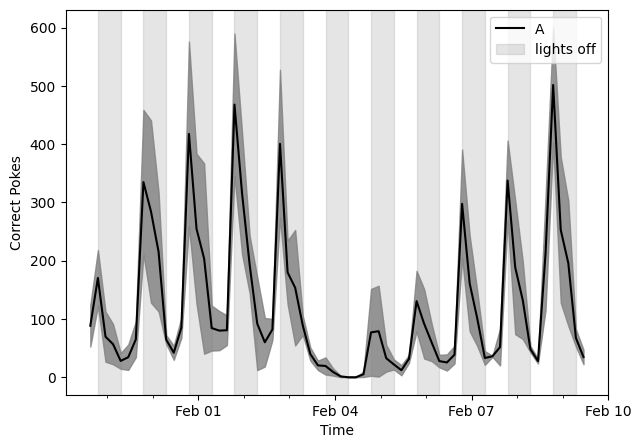
When plotting grouped data, the group names are used as keys instead of individual FED names. Also, depending on the plotting function, there may be specific arguments to manage keywords directed at different elements:
fplot.line({'A': feds[0:3]}, y='correct_pokes', bins='4H',
           line_kwargs={'color':'black'}, error_kwargs={'color':'gray', 'alpha':0.8})
plt.show()
Getting plot data
Plotting functions from fed3 can also be used as jumping off points for analyses or other plotting code.
Most functions have an output argument which determines the object returned.
Options are typically:
- 'plot': the matplotlib Figure
- 'data': a pandas DataFrame containing the data being plotted
- 'dataonly': similar to 'data', except the plot is not created
- 'both': a tuple of the figure and data
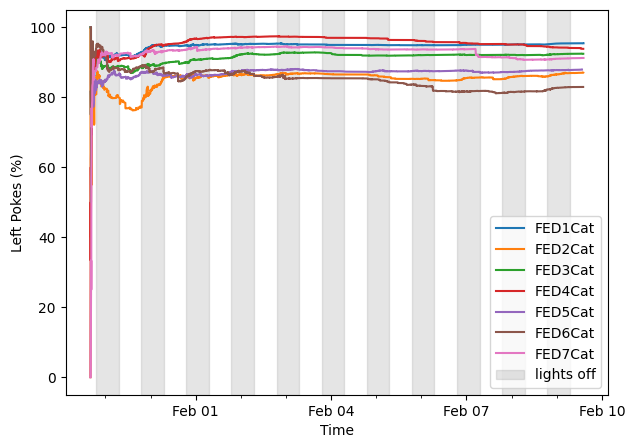
data = fplot.line(feds, y='cumulative_left_percent', output='data')
plt.show()
display(data)
| FED1Cat | FED2Cat | FED3Cat | FED4Cat | FED5Cat | FED6Cat | FED7Cat | |
|---|---|---|---|---|---|---|---|
| 2021-01-29 15:59:31 | NaN | NaN | 100.0 | NaN | NaN | NaN | NaN |
| 2021-01-29 15:59:53 | NaN | NaN | 100.0 | NaN | NaN | NaN | NaN |
| 2021-01-29 16:01:01 | NaN | 100.0 | NaN | NaN | NaN | NaN | NaN |
| 2021-01-29 16:01:52 | NaN | 100.0 | NaN | NaN | NaN | NaN | NaN |
| 2021-01-29 16:02:50 | NaN | NaN | 100.0 | NaN | NaN | NaN | NaN |
| ... | ... | ... | ... | ... | ... | ... | ... |
| 2021-02-09 14:09:31 | NaN | NaN | NaN | NaN | NaN | NaN | 91.213188 |
| 2021-02-09 14:12:00 | 95.412602 | NaN | NaN | NaN | NaN | NaN | NaN |
| 2021-02-09 14:13:56 | NaN | NaN | NaN | NaN | NaN | NaN | 91.214594 |
| 2021-02-09 14:14:00 | 95.413005 | NaN | NaN | NaN | NaN | NaN | NaN |
| 2021-02-09 14:14:04 | NaN | NaN | NaN | NaN | NaN | NaN | 91.216000 |
54806 rows × 7 columns
Expand source code
# -*- coding: utf-8 -*-

'''
.. include:: ../../docs/plots_getting_started.md
'''

# define options
OPTIONS = {'default_shadedark': True,
           'default_legend': True}

# imports for package namespace

from .barchart import bar
from .chronogram import (chronogram_circle, chronogram_line, chronogram_spiny)
from .helpers import argh, legend
from .ipi import (ipi)
from .shadedark import shade_darkness
from .simple import (line, scatter)

__all__ = ['argh',
           'bar',
           'chronogram_circle',
           'chronogram_line',
           'chronogram_spiny',
           'ipi',
           'legend',
           'line',
           'scatter',
           'shade_darkness']
Sub-modules
fed3.plot.barchart-
Bar charts …
fed3.plot.chronogram-
Created on Tue Apr 5 17:40:10 2022 …
fed3.plot.format_axis-
Created on Sun May 9 15:24:38 2021 …
fed3.plot.helpers-
Created on Wed Feb 2 12:34:52 2022 …
fed3.plot.shadedark-
Created on Sun May 9 15:26:30 2021 …
fed3.plot.simple-
Created on Fri Apr 30 18:06:53 2021 …
Functions
def argh(args)-
argh = arg helper. Use this to pass each argument in
argsone at a time to each curve being plotted. If not used, a list of args will be passed to each curve in its entirety.Parameters
args:list-like- Arguments to pass out.
Returns
ArgHelper- Object for distributing the arguments.
Expand source code
def argh(args):
    '''
    argh = arg helper.  Use this to pass each argument in `args`
    one at a time to each curve being plotted.  If not used,
    a list of args will be passed to each curve in its entirety.

    Parameters
    ----------
    args : list-like
        Arguments to pass out.

    Returns
    -------
    ArgHelper
        Object for distributing the arguments.

    '''
    return ArgHelper(args)
def bar(feds, y='pellets', stat='max', normalize=None, agg='mean', var='std', mixed_align='raise', show_individual=False, spread=0.3, positions=None, position_labels=None, legend=None, ax=None, output='plot', bar_kwargs=None, error_kwargs=None, scatter_kwargs=None, **kwargs)-
Create a vertical bar chart.
Parameters
feds:FEDFrame, list-like,ordict-
FED3 data to be plotted.
- FEDFrame: A single line is plotted for this object
- list-like: If a collection of FEDFrames is passed,
an individual line is plotted for every FEDFrame within
feds - dict: If a
dictis passed, the data are treated as being grouped, and average lines are plotted. The dict should have group labels as keys, and FEDFrame objects as values. Note that the values can be either single FEDFrame objects or list-like collections of them. Though if all the values of thedictare single FEDFrame objects, the data will be treated as if there are no groups.
y:str, optional- Metric to plot on y-axis. See
fed3.metricsorlist_metrics()for available options. The default is 'pellets'. stat:strorcallable, optional- Function used to collapse time series data to a point value.
The default is 'max'.
With
y='pellets', the maximum of the pellet count is plotted. Other common options would be 'mean' or 'median'. normalize:str, optional- Normalize the values plotted to a time window. The default is None, in which case no normalization is done. For example, using '1H' would divide the metric being plotted by the number of hours of the FEDFrame.
agg:strorcallable, optional- How to aggregate the point values being plotted from different FEDs when grouping data. The default is 'mean'. Only relevant when grouped data are being plotted.
var:strorcallable, optional- How to show the variation around the bar. The default is 'std'.
mixed_align:str, optional- Protocol when encountering FEDFrames with mixed aligment being plotted.
The default is 'raise'.
See
screen_mixed_alignment()for options. show_individual:bool, optional- When grouping data, show each individual FED's data as a point floating around the bar. The default is False.
spread:float, optional- Parameter for controling the spread of points when using
show_individual. The default is 0.3. positions:listofint, optional- List of integers which can be used to determine the position & grouping
of bars being plotted. The default is None.
Positions should have a length
equal to the number of bars, and should only contain ascending integers.
Bars with the same integer label will be grouped side by side.
For example,
a group of 4 bars could be grouped into sets of 2 with
positions=[0, 0, 1, 1].positions=[0, 1, 2, 3]would evenly space bars (this is the default behavior, set whenNoneis passed.) position_labels:listofstr, optional- Labels for each position of bars being plotted. The default is None.
legend:boolorNone, optional- Create a legend. The default is None, in which case follows
fed3.plot.OPTIONS['default_legend']. ax:matplotlib Axes, optional- Axes to direct the plotting to. The default is None, in which case
plt.gca()is used. output:str, optional-
Specify function behavior and return value. The default is 'plot'.
- plot: Plot is created and the matplotlib Figure is returned.
- data: Plot is created, and underlying processed data are returned (as a pandas DataFrame).
- both: Plot is created, and the return value is a 2-tuple with the first element being the Figure, and second element being the data.
- dataonly: Plot is NOT created; only the processed data are returned.
- anything else: a
ValueErroris raised.
bar_kwargs:dict-like, optional-
Dictionary for providing kwargs to matplotlib, specifically
ax.bar().- If the dictionary key corresponds to the name of a FEDFrame being plotted,
or the name of a group of FEDFrames being plotted, then the value
should be another dictionary mapping keyword arguments for
ax.bar()to their values. - Otherwise, the keys are assumed to be keywords arguments for
ax.bar(), and values are the argument values. In this case, the kwargs are applied to all lines being plotted.
- If the dictionary key corresponds to the name of a FEDFrame being plotted,
or the name of a group of FEDFrames being plotted, then the value
should be another dictionary mapping keyword arguments for
error_kwargs:dict-like, optional-
Dictionary for providing kwargs to matplotlib, specifically
ax.errorbar().- If the dictionary key corresponds to the name of a FEDFrame being plotted,
or the name of a group of FEDFrames being plotted, then the value
should be another dictionary mapping keyword arguments for
ax.errorbar()to their values. - Otherwise, the keys are assumed to be keywords arguments for
ax.errorbar(), and values are the argument values. In this case, the kwargs are applied to all lines being plotted.
- If the dictionary key corresponds to the name of a FEDFrame being plotted,
or the name of a group of FEDFrames being plotted, then the value
should be another dictionary mapping keyword arguments for
scatter_kwargs:dict-like, optional-
Dictionary for providing kwargs to matplotlib, specifically
ax.scatter().- If the dictionary key corresponds to the name of a FEDFrame being plotted,
or the name of a group of FEDFrames being plotted, then the value
should be another dictionary mapping keyword arguments for
ax.scatter()to their values. - Otherwise, the keys are assumed to be keywords arguments for
ax.scatter(), and values are the argument values. In this case, the kwargs are applied to all lines being plotted.
- If the dictionary key corresponds to the name of a FEDFrame being plotted,
or the name of a group of FEDFrames being plotted, then the value
should be another dictionary mapping keyword arguments for
**kwargs:dict-like- Keyword arguments passed to
ax.bar().
Returns
variable- Dependent on parameter
output.
Expand source code
def bar(feds, y='pellets', stat='max', normalize=None, agg='mean', var='std',
        mixed_align='raise', show_individual=False, spread=0.3, positions=None,
        position_labels=None, legend=None, ax=None, output='plot', bar_kwargs=None,
        error_kwargs=None, scatter_kwargs=None, **kwargs):
    '''
    Create a vertical bar chart.

    Parameters
    ----------
    feds : FEDFrame, list-like, or dict
        FED3 data to be plotted.

        - **FEDFrame**: A single line is plotted for this object
        - **list-like**: If a collection of FEDFrames is passed,
        an individual line is plotted for every FEDFrame within `feds`
        - **dict**: If a `dict` is passed, the data are treated as being
        grouped, and average lines are plotted.  The dict should have
        group labels as keys, and FEDFrame objects as values.  Note that
        the values can be either single FEDFrame objects or list-like collections
        of them.  Though if all the values of the `dict` are single FEDFrame
        objects, the data will be treated as if there are no groups.

    y : str, optional
        Metric to plot on y-axis. See `fed3.metrics` or `fed3.metrics.list_metrics()`
        for available options.  The default is 'pellets'.
    stat : str or callable, optional
        Function used to collapse time series data to a point value.
        The default is 'max'.  With `y='pellets'`, the maximum of the pellet
        count is plotted.  Other common options would be 'mean' or
        'median'.
    normalize : str, optional
        Normalize the values plotted to a time window. The default is None,
        in which case no normalization is done.  For example, using '1H'
        would divide the metric being plotted by the number of hours of
        the FEDFrame.
    agg : str or callable, optional
        How to aggregate the point values being plotted from different FEDs
        when grouping data. The default is 'mean'.  Only relevant when
        grouped data are being plotted.
    var : str or callable, optional
        How to show the variation around the bar.  The default is 'std'.
    mixed_align : str, optional
        Protocol when encountering FEDFrames with mixed aligment being plotted.
        The default is 'raise'.  See `fed3.core.fedfuncs.screen_mixed_alignment()`
        for options.
    show_individual : bool, optional
        When grouping data, show each individual FED's data as a point floating
        around the bar. The default is False.
    spread : float, optional
        Parameter for controling the spread of points when using `show_individual`.
        The default is 0.3.
    positions : list of int, optional
        List of integers which can be used to determine the position & grouping
        of bars being plotted. The default is None.  Positions should have a length
        equal to the number of bars, and should only contain ascending integers.
        Bars with the same integer label will be grouped side by side.  For example,
        a group of 4 bars could be grouped into sets of 2 with
        `positions=[0, 0, 1, 1]`.  `positions=[0, 1, 2, 3]` would evenly
        space bars (this is the default behavior, set when `None` is passed.)
    position_labels : list of str, optional
        Labels for each position of bars being plotted. The default is None.
    legend : bool or None, optional
        Create a legend. The default is None, in which case follows
        `fed3.plot.OPTIONS['default_legend']`.
    ax : matplotlib Axes, optional
        Axes to direct the plotting to. The default is None, in which case
        `plt.gca()` is used.
    output : str, optional
        Specify function behavior and return value. The default is 'plot'.

        - **plot**: Plot is created and the matplotlib Figure is returned.
        - **data**: Plot is created, and underlying processed data are returned
        (as a pandas DataFrame).
        - **both**: Plot is created, and the return value is a 2-tuple with
        the first element being the Figure, and second element being the data.
        - **dataonly**: Plot is NOT created; only the processed data are returned.
        - anything else: a `ValueError` is raised.

    bar_kwargs : dict-like, optional
        Dictionary for providing kwargs to matplotlib, specifically `ax.bar()`.

        - If the dictionary key corresponds to the name of a FEDFrame being plotted,
        or the name of a group of FEDFrames being plotted, then the value
        should be another dictionary mapping keyword arguments for `ax.bar()`
        to their values.
        - Otherwise, the keys are assumed to be keywords arguments for `ax.bar()`,
        and values are the argument values.  In this case, the kwargs are applied
        to all lines being plotted.

    error_kwargs : dict-like, optional
        Dictionary for providing kwargs to matplotlib, specifically `ax.errorbar()`.

        - If the dictionary key corresponds to the name of a FEDFrame being plotted,
        or the name of a group of FEDFrames being plotted, then the value
        should be another dictionary mapping keyword arguments for `ax.errorbar()`
        to their values.
        - Otherwise, the keys are assumed to be keywords arguments for `ax.errorbar()`,
        and values are the argument values.  In this case, the kwargs are applied
        to all lines being plotted.

    scatter_kwargs : dict-like, optional
        Dictionary for providing kwargs to matplotlib, specifically `ax.scatter()`.

        - If the dictionary key corresponds to the name of a FEDFrame being plotted,
        or the name of a group of FEDFrames being plotted, then the value
        should be another dictionary mapping keyword arguments for `ax.scatter()`
        to their values.
        - Otherwise, the keys are assumed to be keywords arguments for `ax.scatter()`,
        and values are the argument values.  In this case, the kwargs are applied
        to all lines being plotted.
    **kwargs : dict-like
        Keyword arguments passed to `ax.bar()`.

    Returns
    -------
    variable
        Dependent on parameter `output`.

    '''

    # parse inputs
    feds_dict = _parse_feds(feds)
    not_group = all(len(f) == 1 for f in feds_dict.values())
    if not_group:
        var = None

    # set the outputs
    FIG = None
    DATA = pd.DataFrame()

    # setup input arguments
    feds_all = []
    for l in feds_dict.values():
        feds_all += l

    # screen issues alignment
    alignment = screen_mixed_alignment(feds_all, option=mixed_align)

    # compute plot data
    metric_obj = get_metric(y)
    metric = metric_obj.func
    metricname = metric_obj.nicename
    if normalize is not None:
        metricname += f' ({normalize})'
    DATA = _bar_metric_df(feds_dict, metric=metric, stat=stat,
                          normalize=normalize, agg=agg, var=var)
    individual_data = DATA.iloc[:, :-2]
    barvals = DATA.iloc[:, -2]
    errors = DATA.iloc[:, -1]

    # determine plotting order
    if position_labels is None and positions is None:
        position_labels = feds_dict.keys()
    position_width = 0.75
    centers, positions, bar_widths = _assign_bar_positions_widths(feds,
                                                                  positions,
                                                                  position_width=position_width)

    # update the kwargs to handle individual & general options
    bar_kwargs = {} if bar_kwargs is None else bar_kwargs
    bar_kwargs.update(kwargs) # general kwargs default to bar
    bar_kwargs = _process_plot_kwargs(bar_kwargs, feds_dict.keys())

    error_kwargs = {} if error_kwargs is None else error_kwargs
    error_kwargs = _process_plot_kwargs(error_kwargs, feds_dict.keys())

    scatter_kwargs = {} if scatter_kwargs is None else scatter_kwargs
    scatter_kwargs = _process_plot_kwargs(scatter_kwargs, feds_dict.keys())

    # handle plot creation and returns
    if output in ['plot', 'data', 'both']:

        if ax is None:
            ax = plt.gca()

        FIG = ax.get_figure()

        for i, label in enumerate(DATA.index):

            # set keyword args for main bar (first plotted)
            this_bar_kwargs = {'label':label,
                               'zorder':0,
                               'width': bar_widths[i]}
            this_bar_kwargs.update(bar_kwargs[label])

            # plot the bars
            x = positions[i]
            y = barvals[i]
            ax.bar(x, y, **this_bar_kwargs)

            # now set keyword args for error, grabbing most recent color
            this_error_kwargs = {'color':'grey',
                                 'ls':'none',
                                 'capsize':5,
                                 'zorder':2}
            this_error_kwargs.update(error_kwargs[label])

            this_scatter_kwargs = {'color':_get_most_recent_color(ax=ax, kind='bar'),
                                   'zorder':1,
                                   'edgecolor':'k'}
            this_scatter_kwargs.update(scatter_kwargs[label])


            # error bars
            if var is not None:
                err = errors[i]
                ax.errorbar(x=x, y=y, yerr=err, **this_error_kwargs)

            if show_individual:
                w = bar_widths[i] * spread
                ys = individual_data.iloc[i, :].dropna()
                xs = _jitter_ys(ys, x, w)
                ax.scatter(xs, ys, **this_scatter_kwargs)

        # format the axes
        ax.set_ylabel(metricname)
        ax.set_xticks(centers)
        if position_labels is not None:
            ax.set_xticklabels(position_labels)

        legend = OPTIONS['default_legend'] if legend is None else legend
        if legend:
            ax.legend()

    # output was weird for lists without this step -
    # treated each single FED as group, and created
    # a DF with lots of unhelpful info
    if not_group:
        DATA = DATA.drop(DATA.index, axis=1)
        DATA = DATA.iloc[:, :-1]

    return _get_return_value(FIG=FIG, DATA=DATA, output=output)
def chronogram_circle(feds, y='pellets', bins='1H', agg='mean', var='std', mixed_align='raise', output='plot', shadedark=None, ax=None, legend=None, line_kwargs=None, error_kwargs=None, **kwargs)-
Expand source code
def chronogram_circle(feds, y='pellets', bins='1H', agg='mean', var='std',
                      mixed_align='raise', output='plot',
                      shadedark=None, ax=None, legend=None,
                      line_kwargs=None, error_kwargs=None, **kwargs):

    # parse input
    feds_dict = _parse_feds(feds)
    is_group = any(len(v) > 1 for v in feds_dict.values())
    var = var if is_group else None

    # set the outputs
    FIG = None
    DATA = pd.DataFrame()

    # setup input arguments
    feds_all = []
    for l in feds_dict.values():
        feds_all += l

    # screen issues alignment
    alignment = screen_mixed_alignment(feds_all, option=mixed_align)

    # compute data
    metric_obj = get_metric(y)
    metric = metric_obj.func
    metricname = metric_obj.nicename
    AGGDATA, VARDATA = _create_group_chronogram_df(feds_dict=feds_dict, metric=metric, bins=bins,
                                                   agg=agg, var=var, origin_lightcycle=True,
                                                   reorder_index=True, relative_index=True)

    # create return data
    if var is None:
        DATA = AGGDATA
    else:
        lsuffix = f"_{agg}" if isinstance(agg, str) else "_agg"
        rsuffix = f"_{var}" if isinstance(var, str) else "_var"
        DATA = AGGDATA.join(VARDATA, how='outer', lsuffix=lsuffix, rsuffix=rsuffix)

    # update the kwargs to handle individual & general options
    line_kwargs = {} if line_kwargs is None else line_kwargs
    line_kwargs.update(kwargs) # general kwargs default to updatine line
    line_kwargs = _process_plot_kwargs(line_kwargs, feds_dict.keys())

    error_kwargs = {} if error_kwargs is None else error_kwargs
    error_kwargs = _process_plot_kwargs(error_kwargs, feds_dict.keys())

    # handle plot creation and returns
    if output in ['plot', 'data', 'both']:

        if ax is None:
            fig, ax = plt.subplots(subplot_kw=dict(polar=True))
        ax.set_theta_zero_location("N")
        ax.set_theta_direction(-1)

        FIG = ax.get_figure()

        # plot group level data
        for i, col in enumerate(AGGDATA.columns):

            # set kwargs for main plot
            this_kwargs = {}
            this_kwargs['label'] = col
            this_kwargs.update(line_kwargs[col])

            # plot
            y = AGGDATA[col]
            y = np.append(y, y[0])
            x = np.linspace(0, 2*np.pi, len(y))
            ax.plot(x, y, **this_kwargs)

            # set error_kwargs, grabbing most recent color
            this_error_kwargs = {}
            this_error_kwargs['color'] = _get_most_recent_color(ax=ax, kind='line')
            this_error_kwargs['alpha'] = 0.3
            this_error_kwargs.update(error_kwargs[col])

            # plot error
            if not VARDATA.empty:

                y = AGGDATA[col]
                y = np.append(y, y[0])
                v = VARDATA[col]
                v = np.append(v, v[0])
                x = np.linspace(0, 2*np.pi, len(y))

                ax.fill_between(x, y-v, y+v, **this_error_kwargs)

            # plot individual lines
            if var == 'raw':

                group_feds = feds_dict[col]
                metric_df = _create_chronogram_df(feds_list=group_feds,
                                                  metric=metric,
                                                  bins=bins,
                                                  origin_lightcycle=True,
                                                  reorder_index=True,
                                                  relative_index=True)
                for col in metric_df.columns:
                    y = metric_df[col]
                    y = np.append(y, y[0])
                    x = np.linspace(0, 2*np.pi, len(y))
                    ax.plot(x, y, **this_error_kwargs)

        # axis level formatting
        ax.set_xlabel("Hour of Light Cycle")
        ax.set_xticks(np.linspace(0, 2*np.pi, 5))
        ax.set_xticklabels([0, 6, 12, 18, None])
        ax.set_title(metricname, pad=10)

        shadedark = OPTIONS['default_shadedark'] if shadedark is None else shadedark
        if shadedark:
            on, off = LIGHTCYCLE['on'], LIGHTCYCLE['off']
            on = time_to_float(on)
            off = time_to_float(off)
            off += (on > off) * 24
            start = off - on
            theta = (start / 24) * 2 * np.pi
            ax.fill_between(np.linspace(theta, 2*np.pi, 100), 0, ax.get_rmax(),
                            color='gray',alpha=.2,zorder=0,label='lights off')

        legend = OPTIONS['default_legend'] if legend is None else legend
        if legend:
            ax.legend()

    return _get_return_value(FIG=FIG, DATA=DATA, output=output)
def chronogram_line(feds, y='pellets', bins='15T', agg='mean', var='std', mixed_align='raise', output='plot', shadedark=None, ax=None, legend=None, line_kwargs=None, error_kwargs=None, **kwargs)-
Expand source code
def chronogram_line(feds, y='pellets', bins='15T', agg='mean', var='std',
                    mixed_align='raise', output='plot',
                    shadedark=None, ax=None, legend=None,
                    line_kwargs=None, error_kwargs=None, **kwargs):

    # parse input
    feds_dict = _parse_feds(feds)
    is_group = any(len(v) > 1 for v in feds_dict.values())
    var = var if is_group else None

    # set the outputs
    FIG = None
    DATA = pd.DataFrame()

    # setup input arguments
    feds_all = []
    for l in feds_dict.values():
        feds_all += l

    # screen issues alignment
    alignment = screen_mixed_alignment(feds_all, option=mixed_align)

    # compute data
    metric_obj = get_metric(y)
    metric = metric_obj.func
    metricname = metric_obj.nicename
    AGGDATA, VARDATA = _create_group_chronogram_df(feds_dict=feds_dict, metric=metric, bins=bins,
                                                   agg=agg, var=var, origin_lightcycle=True,
                                                   reorder_index=True, relative_index=True)

    # create return data
    if var is None:
        DATA = AGGDATA
    else:
        lsuffix = f"_{agg}" if isinstance(agg, str) else "_agg"
        rsuffix = f"_{var}" if isinstance(var, str) else "_var"
        DATA = AGGDATA.join(VARDATA, how='outer', lsuffix=lsuffix, rsuffix=rsuffix)

    # update the kwargs to handle individual & general options
    line_kwargs = {} if line_kwargs is None else line_kwargs
    line_kwargs.update(kwargs) # general kwargs default to updatine line
    line_kwargs = _process_plot_kwargs(line_kwargs, feds_dict.keys())

    error_kwargs = {} if error_kwargs is None else error_kwargs
    error_kwargs = _process_plot_kwargs(error_kwargs, feds_dict.keys())

    # handle plot creation and returns
    if output in ['plot', 'data', 'both']:

        if ax is None:
            ax = plt.gca()

        FIG = ax.get_figure()

        # plot group level data
        for i, col in enumerate(AGGDATA.columns):

            # set kwargs for main plot
            this_kwargs = {}
            this_kwargs['label'] = col
            this_kwargs.update(line_kwargs[col])

            # plot
            y = AGGDATA[col]
            x = AGGDATA.index
            ax.plot(x, y, **this_kwargs)

            this_error_kwargs = {}
            this_error_kwargs['color'] = _get_most_recent_color(ax=ax, kind='line')
            this_error_kwargs['alpha'] = 0.3
            this_error_kwargs.update(error_kwargs[col])

            # plot error
            if not VARDATA.empty:
                y = AGGDATA[col]
                x = y.index
                v = VARDATA[col]
                ax.fill_between(x, y-v, y+v, **this_error_kwargs)

            # plot individual lines
            if var == 'raw':

                group_feds = feds_dict[col]
                metric_df = _create_chronogram_df(feds_list=group_feds,
                                                  metric=metric,
                                                  bins=bins,
                                                  origin_lightcycle=True,
                                                  reorder_index=True,
                                                  relative_index=True)
                for col in metric_df.columns:
                    y = metric_df[col]
                    x = y.index
                    ax.plot(x, y, **this_error_kwargs)

        # axis level formatting
        ax.set_ylabel(metricname)
        ax.set_xlabel("Hour of Light Cycle")

        ax.set_xticks([0, 6, 12, 18, 24])

        shadedark = OPTIONS['default_shadedark'] if shadedark is None else shadedark
        if shadedark:
            on, off = LIGHTCYCLE['on'], LIGHTCYCLE['off']
            on = time_to_float(on)
            off = time_to_float(off)
            off += (on > off) * 24
            start = off - on
            ax.axvspan(start, 24, color='gray', alpha=.2, zorder=0, label='lights off')

        legend = OPTIONS['default_legend'] if legend is None else legend
        if legend:
            ax.legend(bbox_to_anchor=(1,1), loc='upper left')

    return _get_return_value(FIG=FIG, DATA=DATA, output=output)
def chronogram_spiny(feds, y='pellets', bins='15T', agg='mean', mixed_align='raise', output='plot', shadedark=None, ax=None, legend=None, plot_quick=True, **kwargs)-
Expand source code
def chronogram_spiny(feds, y='pellets', bins='15T', agg='mean',
                     mixed_align='raise', output='plot',
                     shadedark=None, ax=None, legend=None,
                     plot_quick=True, **kwargs):

    # handle parsing here, to only accept single groups
    feds_dict = _parse_feds_spiny_chronogram(feds)

    # set the outputs
    FIG = None
    DATA = pd.DataFrame()

    # setup input arguments
    feds_all = []
    for l in feds_dict.values():
        feds_all += l

    # screen issues alignment
    alignment = screen_mixed_alignment(feds_all, option=mixed_align)

    # compute data
    metric_obj = get_metric(y)
    metric = metric_obj.func
    metricname = metric_obj.nicename
    DATA, _ = _create_group_chronogram_df(feds_dict=feds_dict, metric=metric, bins=bins,
                                          agg=agg, var=None, origin_lightcycle=True,
                                          reorder_index=True, relative_index=True)

    # handle plot creation and returns
    if output in ['plot', 'data', 'both']:

        if ax is None:
            FIG, ax = plt.subplots(subplot_kw=dict(polar=True))
        ax.set_theta_zero_location("N")
        ax.set_theta_direction(-1)

        FIG = ax.get_figure()

        # set keyword args passed
        kwargs['color'] = 'crimson' if not kwargs.get('color') else kwargs.get('color')

        # plot
        if plot_quick:
            y = list(DATA.iloc[:, 0]) + [0]
            x = np.linspace(0, 2*np.pi, len(y))
            x, y = _spine_data_trick(x, y)
            ax.plot(x, y, **kwargs)
        else:
            y = DATA.iloc[:, 0]
            x = np.linspace(0, 2*np.pi, len(y)+1)
            for n, val in enumerate(y):
                label = n * '_' + DATA.columns[0]
                ax.plot([0, x[n]], [0, val], label=label, **kwargs)

        # axis level formatting
        ax.set_xlabel("Hour of Light Cycle")
        ax.set_xticks(np.linspace(0, 2*np.pi, 5))
        ax.set_xticklabels([0, 6, 12, 18, None])
        ax.set_title(metricname, pad=10)

        shadedark = OPTIONS['default_shadedark'] if shadedark is None else shadedark
        if shadedark:
            on, off = LIGHTCYCLE['on'], LIGHTCYCLE['off']
            on = time_to_float(on)
            off = time_to_float(off)
            off += (on > off) * 24
            start = off - on
            theta = (start / 24) * 2 * np.pi
            ax.fill_between(np.linspace(theta, 2*np.pi, 100), 0, ax.get_rmax(),
                            color='gray',alpha=.2,zorder=0,label='lights off')

        legend = OPTIONS['default_legend'] if legend is None else legend
        if legend:
            ax.legend(bbox_to_anchor=(1,1), loc='upper left')

    return _get_return_value(FIG=FIG, DATA=DATA, output=output)
def ipi(feds, logx=True, kde=True, mixed_align='raise', output='plot', ax=None, legend=None, **kwargs)-
Expand source code
def ipi(feds, logx=True, kde=True, mixed_align='raise', output='plot',
        ax=None, legend=None, **kwargs):

    # set the outputs
    FIG = None
    DATA = pd.DataFrame()

    # setup input arguments
    feds_dict = _parse_feds(feds)
    is_group = any(len(v) > 1 for v in feds_dict.values())
    feds_all = []
    for l in feds_dict.values():
        feds_all += l

    # screen issues alignment
    alignment = screen_mixed_alignment(feds_all, option=mixed_align)

    # compute data for individual feds
    y = 'ipi'
    metric_obj = get_metric(y)
    metric = metric_obj.func
    metricname = metric_obj.nicename
    DATA = _create_metric_df(feds_list=feds_all, metric=metric)
    if is_group:
        DATA = _stack_group_values(DATA, feds_dict)

    legend = OPTIONS['default_legend'] if legend is None else legend

    # handle plot creation and returns
    if output in ['plot', 'data', 'both']:

        if ax is None:
            ax = plt.gca()

        FIG = _plot_hist_data(ax=ax,
                              data=DATA,
                              logx=logx,
                              kde=kde,
                              legend=legend,
                              **kwargs)

        ax.set_xlabel(metricname)

    return _get_return_value(FIG=FIG, DATA=DATA, output=output)
def legend(*args, **kwargs)-
Convenience method for calling
plt.legend()to generate a legendExpand source code
def legend(*args, **kwargs):
    '''Convenience method for calling `plt.legend()` to generate a legend'''
    plt.legend(*args, **kwargs)
def line(feds, y='pellets', bins=None, agg='mean', var='std', omit_na=True, mixed_align='raise', output='plot', xaxis='auto', shadedark=None, ax=None, legend=None, line_kwargs=None, error_kwargs=None, **kwargs)-
Create a line plot, with time on the x-axis and a variable of interest on the y-axis.
Parameters
feds:FEDFrame, list-like,ordict-
FED3 data to be plotted.
- FEDFrame: A single line is plotted for this object
- list-like: If a collection of FEDFrames is passed,
an individual line is plotted for every FEDFrame within
feds - dict: If a
dictis passed, the data are treated as being grouped, and average lines are plotted. The dict should have group labels as keys, and FEDFrame objects as values. Note that the values can be either single FEDFrame objects or list-like collections of them. Though if all the values of thedictare single FEDFrame objects, the data will be treated as if there are no groups.
y:str, optional- Metric to plot on y-axis. See
fed3.metricsorlist_metrics()for available options. The default is 'pellets'. bins:pandas time offset string, optional- Frequency string denoting how data should be binned when plotting.
The default is None, in which case there is no binnings.
Examples
are '1H' for 1 hour or '15T' for 15 minutes.
When group data are passed
(see
feds) andbinsis not specified, defaults to1H. agg:strorcallable, optional- Function to aggregate data from multiple FEDFrames in a group (for each temporal bin). The default is 'mean'. Only relevant when grouped data are being plotted.
var:strorcallable, optional- Function to measure variation of data from multiple FEDFrames in a group (for each temporal bin). The default is 'std'. The output of this callable is represented as a shaded error bar around the line. Only relevant when grouped data are being plotted. The default is 'std'.
omit_na:bool, optional- When True, omits bins in a group where at least one FEDFrame has missing data. Only relevant when grouped data are being plotted. The default is True.
mixed_align:str, optional- Protocol when encountering FEDFrames with mixed aligment being plotted.
The default is 'raise'.
See
screen_mixed_alignment()for options. output:str, optional-
Specify function behavior and return value. The default is 'plot'.
- plot: Plot is created and the matplotlib Figure is returned.
- data: Plot is created, and underlying processed data are returned (as a pandas DataFrame).
- both: Plot is created, and the return value is a 2-tuple with the first element being the Figure, and second element being the data.
- dataonly: Plot is NOT created; only the processed data are returned.
- anything else: a
ValueErroris raised.
xaxis:str, optional- X-axis type to used for plotting. This is usually determined by the alignment of the FEDFrames, and should be handled by 'auto' (default). Other options are 'datetime', 'time', and 'elapsed'.
shadedark:boolorNone, optional- When applicable based on the FEDFrame alignment, create shaded
boxes indicating when the lights were off. The default is None,
in which case follows
fed3.plot.OPTIONS['default_shadedark']. ax:matplotlib Axes, optional- Axes to direct the plotting to. The default is None, in which case
plt.gca()is used. legend:boolorNone, optional- Create a legend. The default is None, in which case follows
fed3.plot.OPTIONS['default_legend']. line_kwargs:dict-like, optional-
Dictionary for providing kwargs to matplotlib, specifically
ax.plot().- If the dictionary key corresponds to the name of a FEDFrame being plotted,
or the name of a group of FEDFrames being plotted, then the value
should be another dictionary mapping keyword arguments for
ax.plot()to their values. - Otherwise, the keys are assumed to be keywords arguments for
ax.plot(), and values are the argument values. In this case, the kwargs are applied to all lines being plotted.
- If the dictionary key corresponds to the name of a FEDFrame being plotted,
or the name of a group of FEDFrames being plotted, then the value
should be another dictionary mapping keyword arguments for
error_kwargs:dict-like, optional-
Dictionary for providing kwargs to matplotlib, specifically
ax.fill_between().- If the dictionary key corresponds to the name of a FEDFrame being plotted,
or the name of a group of FEDFrames being plotted, then the value
should be another dictionary mapping keyword arguments for
ax.fill_between()to their values. - Otherwise, the keys are assumed to be keywords arguments for
ax.fill_between(), and values are the argument values. In this case, the kwargs are applied to all lines being plotted.
- If the dictionary key corresponds to the name of a FEDFrame being plotted,
or the name of a group of FEDFrames being plotted, then the value
should be another dictionary mapping keyword arguments for
**kwargs:dict-like- Passed to updated
line_kwargs.
Returns
variable- Dependent on parameter
output.
Expand source code
def line(feds, y='pellets', bins=None, agg='mean', var='std',
         omit_na=True, mixed_align='raise', output='plot',
         xaxis='auto', shadedark=None, ax=None, legend=None,
         line_kwargs=None, error_kwargs=None, **kwargs):
    '''
    Create a line plot, with time on the x-axis and a variable
    of interest on the y-axis.

    Parameters
    ----------
    feds : FEDFrame, list-like, or dict
        FED3 data to be plotted.

        - **FEDFrame**: A single line is plotted for this object
        - **list-like**: If a collection of FEDFrames is passed,
        an individual line is plotted for every FEDFrame within `feds`
        - **dict**: If a `dict` is passed, the data are treated as being
        grouped, and average lines are plotted.  The dict should have
        group labels as keys, and FEDFrame objects as values.  Note that
        the values can be either single FEDFrame objects or list-like collections
        of them.  Though if all the values of the `dict` are single FEDFrame
        objects, the data will be treated as if there are no groups.

    y : str, optional
        Metric to plot on y-axis. See `fed3.metrics` or `fed3.metrics.list_metrics()`
        for available options.  The default is 'pellets'.
    bins : pandas time offset string, optional
        Frequency string denoting how data should be binned when plotting.
        The default is None, in which case there is no binnings.  Examples
        are '1H' for 1 hour or '15T' for 15 minutes.  When group data are passed
        (see `feds`) and `bins` is not specified, defaults to `1H`.
    agg : str or callable, optional
        Function to aggregate data from multiple FEDFrames in a group (for each
        temporal bin).  The default is 'mean'.  Only relevant when grouped
        data are being plotted.
    var : str or callable, optional
        Function to measure variation of data from multiple FEDFrames in a group
        (for each temporal bin).  The default is 'std'.  The output of this
        callable is represented as a shaded error bar around the line.
        Only relevant when grouped data are being plotted. The default is 'std'.
    omit_na : bool, optional
        When True, omits bins in a group where at least one FEDFrame has
        missing data. Only relevant when grouped data are being plotted.
        The default is True.
    mixed_align : str, optional
        Protocol when encountering FEDFrames with mixed aligment being plotted.
        The default is 'raise'.  See `fed3.core.fedfuncs.screen_mixed_alignment()`
        for options.
    output : str, optional
        Specify function behavior and return value. The default is 'plot'.

        - **plot**: Plot is created and the matplotlib Figure is returned.
        - **data**: Plot is created, and underlying processed data are returned
        (as a pandas DataFrame).
        - **both**: Plot is created, and the return value is a 2-tuple with
        the first element being the Figure, and second element being the data.
        - **dataonly**: Plot is NOT created; only the processed data are returned.
        - anything else: a `ValueError` is raised.

    xaxis : str, optional
        X-axis type to used for plotting. This is usually determined by the
        alignment of the FEDFrames, and should be handled by 'auto' (default).
        Other options are 'datetime', 'time', and 'elapsed'.
    shadedark : bool or None, optional
        When applicable based on the FEDFrame alignment, create shaded
        boxes indicating when the lights were off. The default is None,
        in which case follows `fed3.plot.OPTIONS['default_shadedark']`.
    ax : matplotlib Axes, optional
        Axes to direct the plotting to. The default is None, in which case
        `plt.gca()` is used.
    legend : bool or None, optional
        Create a legend. The default is None, in which case follows
        `fed3.plot.OPTIONS['default_legend']`.
    line_kwargs : dict-like, optional
        Dictionary for providing kwargs to matplotlib, specifically `ax.plot()`.

        - If the dictionary key corresponds to the name of a FEDFrame being plotted,
        or the name of a group of FEDFrames being plotted, then the value
        should be another dictionary mapping keyword arguments for `ax.plot()`
        to their values.
        - Otherwise, the keys are assumed to be keywords arguments for `ax.plot()`,
        and values are the argument values.  In this case, the kwargs are applied
        to all lines being plotted.

    error_kwargs : dict-like, optional
        Dictionary for providing kwargs to matplotlib, specifically `ax.fill_between()`.

        - If the dictionary key corresponds to the name of a FEDFrame being plotted,
        or the name of a group of FEDFrames being plotted, then the value
        should be another dictionary mapping keyword arguments for `ax.fill_between()`
        to their values.
        - Otherwise, the keys are assumed to be keywords arguments for `ax.fill_between()`,
        and values are the argument values.  In this case, the kwargs are applied
        to all lines being plotted.

    **kwargs : dict-like
        Passed to updated `line_kwargs`.

    Returns
    -------
    variable
        Dependent on parameter `output`.

    '''

    feds_dict = _parse_feds(feds)
    is_group = any(len(v) > 1 for v in feds_dict.values())
    bins = '1H' if is_group and bins is None else bins
    var = var if is_group else None

    return _simple_plot(kind='line',
                        feds_dict=feds_dict,
                        y=y,
                        bins=bins,
                        agg=agg,
                        var=var,
                        omit_na=omit_na,
                        mixed_align=mixed_align,
                        output=output,
                        xaxis=xaxis,
                        shadedark=shadedark,
                        ax=ax,
                        legend=legend,
                        plot_kwargs=line_kwargs,
                        error_kwargs=error_kwargs,
                        **kwargs)
def scatter(feds, y='pellets', bins=None, agg='mean', var='std', omit_na=True, mixed_align='raise', output='plot', xaxis='auto', shadedark=None, ax=None, legend=None, point_kwargs=None, error_kwargs=None, **kwargs)-
Expand source code
def scatter(feds, y='pellets', bins=None, agg='mean', var='std',
            omit_na=True, mixed_align='raise', output='plot',
            xaxis='auto', shadedark=None, ax=None, legend=None,
            point_kwargs=None, error_kwargs=None, **kwargs):

    feds_dict = _parse_feds(feds)
    is_group = any(len(v) > 1 for v in feds_dict.values())
    bins = '1H' if is_group and bins is None else bins
    var = var if is_group else None

    return _simple_plot(kind='scatter',
                        feds_dict=feds_dict,
                        y=y,
                        bins=bins,
                        agg=agg,
                        var=var,
                        omit_na=omit_na,
                        mixed_align=mixed_align,
                        output=output,
                        xaxis=xaxis,
                        shadedark=shadedark,
                        ax=ax,
                        legend=legend,
                        plot_kwargs=point_kwargs,
                        error_kwargs=error_kwargs,
                        **kwargs)
def shade_darkness(ax=None, min_date=None, max_date=None, lights_on=None, lights_off=None)-
Shade the night time periods with vertical bars on a datetime x-axis.
Parameters
ax:matplotlib.axes.Axes, optional- Axes to shade. The default is None, in which case uses
plt.gca(). min_date:datetime, optional- Earliest date to shade. The default is None, in which case is inferred from axis.
max_date:TYPE, optional- Latest date to shade. The default is None, in which case is inferred from axis.
lights_on:datetime.time, optional- Time indicating beginning of light cycle. The default is None, in
which case
LIGHTCYCLEis used. lights_off:datetime.time, optional- Time indicating beginning of light cycle. The default is None, in
which case
LIGHTCYCLEis used.
Returns
None.
Expand source code
def shade_darkness(ax=None, min_date=None, max_date=None, lights_on=None, lights_off=None):
    '''
    Shade the night time periods with vertical bars on a datetime x-axis.

    Parameters
    ----------
    ax : matplotlib.axes.Axes, optional
        Axes to shade. The default is None, in which case uses `plt.gca()`.
    min_date : datetime, optional
        Earliest date to shade. The default is None, in which case is inferred
        from axis.
    max_date : TYPE, optional
        Latest date to shade. The default is None, in which case is inferred
        from axis.
    lights_on : datetime.time, optional
        Time indicating beginning of light cycle. The default is None, in
        which case `fed3.lightcycle.LIGHTCYCLE` is used.
    lights_off : datetime.time, optional
        Time indicating beginning of light cycle. The default is None, in
        which case `fed3.lightcycle.LIGHTCYCLE` is used.

    Returns
    -------
    None.

    '''

    if ax is None:
        ax = plt.gca()

    if min_date is None:
        min_date, _ = mdates.num2date(ax.get_xlim())

    if max_date is None:
        _, max_date = mdates.num2date(ax.get_xlim())

    if lights_on is None:
        lights_on = LIGHTCYCLE['on']

    if lights_off is None:
        lights_off = LIGHTCYCLE['off']

    nights = lightcycle_tuples(start_date=min_date,
                               end_date=max_date,
                               lights_on=lights_on,
                               lights_off=lights_off,
                               kind='nights')

    for i, (start, end) in enumerate(nights):
        ax.axvspan(start,
                   end,
                   color='gray',
                   alpha=.2,
                   label='_'*i + 'lights off',
                   zorder=0)