Module wubwub.plots
Various plots for visualizing the contents of a Sequencer.
Expand source code
#!/usr/bin/env python3
# -*- coding: utf-8 -*-
"""
Various plots for visualizing the contents of a `wubwub.sequencer.Sequencer`.
"""
__pdoc__ = {'draw_pianoroll': False}
from numbers import Number
import matplotlib as mpl
import matplotlib.pyplot as plt
from matplotlib.ticker import AutoMinorLocator
from wubwub.errors import WubWubError
from wubwub.pitch import pitch_from_semitones, relative_pitch_to_int
from wubwub.resources import MINUTE
# get the color cycle from mpl
prop_cycle = plt.rcParams['axes.prop_cycle']
colors = prop_cycle.by_key()['color']
def _actual_soundlength(track, element):
'''Return how long a Note/Chord is based on the sample.'''
mpb = 1 / track.get_bpm() * MINUTE
clss = element.__class__.__name__
if clss == 'ArpChord':
return element.length
elif hasattr(element, 'length'):
l = element.length
else:
l = max(n.length for n in element.notes)
if hasattr(track, 'get_sample'):
samplelen = len(track.get_sample(element.pitch)) / mpb
else:
samplelen = len(track.sample) / mpb
return min(l, samplelen)
def sequencerplot(sequencer, timesig=4, grid=True, ax=None, scatter_kwds=None,
plot_kwds=None):
'''
Create a plot showing beats on the x-axis, and Tracks on the y-axis.
Plotted elements correspond to the start and length of each Note in each
Track.
Parameters
----------
sequencer : wubwub.sequencer.Sequencer
A Sequencer.
timesig : int, optional
Sets the ticks/grid to a given frequency of beats. The default is 4.
grid : bool, optional
Whether to include a grid. The default is True.
ax : matplotlib.axes.Axes, optional
Axes to create the plot on. The default is None.
scatter_kwds : dict, optional
Keyword arguments passed to `matplotlib.axes.Axes.scatter`.
The default is None.
plot_kwds : dict, optional
Keyword arguments passed to `matplotlib.axes.Axes.plot`.
The default is None.
Returns
-------
matplotlib.figure.Figure
The Figure containing the axes used.
Examples
--------
Example sequencerplot for the "Electro" example:
```
seq.plot()
```
'''
if ax is None:
ax = plt.gca()
if scatter_kwds is None:
scatter_kwds = {}
if plot_kwds is None:
plot_kwds = {}
if grid:
ax.yaxis.grid(True, which='major', alpha=.3)
ax.xaxis.grid(True, which='major', alpha=.3)
ax.xaxis.grid(which='minor', alpha=.3)
ax.set_ylabel('tracks')
ax.set_xlabel('beats')
yticks = []
ylabs = []
c = 0
for y, track in enumerate(sequencer.tracks()):
color = track.plotting.get('color')
marker = track.plotting.get('marker')
if not color:
color = colors[c]
c += 1
if not marker:
marker = 'o'
beats = track.array_of_beats()
notes = track.notedict.values()
ax.scatter(beats, [-y] * len(beats), color=color, marker=marker,
zorder=5, **scatter_kwds)
yticks.append(-y)
ylabs.append(track.name)
for b, n in zip(beats, notes):
l = _actual_soundlength(track, n)
ax.plot([b, b+l], [-y, -y], color=color, **plot_kwds)
max_beats = sequencer.beats + 1
ax.set_yticks(yticks)
ax.set_yticklabels(ylabs)
beat_range = max_beats
ax.set_xlim(0.5, beat_range + 0.5)
step = 1
xticks = range(1, max_beats+1, step)
c = 1
while len(xticks) > 10:
step = timesig * c
xticks = range(1, max_beats+1, step)
c += 1
ax.set_xticks(xticks)
minor_locator = AutoMinorLocator(2)
ax.xaxis.set_minor_locator(minor_locator)
return ax.figure
def _convert_semitones_str_yaxis(plottype, note, track):
'''Convert scientific pitch notations and relative semitones.'''
if plottype == 'semitones' and isinstance(note.pitch, str):
if not hasattr(track, 'basepitch'):
raise WubWubError('Cannot convert pitch to semitoes with no `basepitch` attribute.')
return relative_pitch_to_int(track.basepitch, note.pitch)
elif plottype == 'pitch' and isinstance(note.pitch, Number):
if not hasattr(track, 'basepitch'):
raise WubWubError('Cannot convert semitones to pitch with no `basepitch` attribute.')
return pitch_from_semitones(track.basepitch, note.pitch)
else:
return note.pitch
def _format_pitch_yaxis(ax, pitchnums, max_range=24, max_pitches=12):
'''Format the y-axis when plotting pitches.'''
lo = min(pitchnums)
hi = max(pitchnums)
pitchrange = hi - lo
if pitchrange > max_range or len(pitchnums) > max_pitches:
yticks = [i for i in range(lo, hi) if i % 12 == 0]
else:
yticks = list(pitchnums)
labels = [pitch_from_semitones('C1', y) for y in yticks]
ax.set_yticks(yticks)
ax.set_yticklabels(labels)
def trackplot(track, yaxis='semitones', timesig=4, grid=True, ax=None,
scatter_kwds=None, plot_kwds=None):
'''
Create a pitch vs. beat plot for one Track.
Parameters
----------
track : wubwub Track
Any wubwub Track class.
yaxis : 'semitones' or 'pitch' or 'names', optional
Determines how elements are plotted on the y-axis.
The default is 'semitones'.
- `'semitones'`: plot semitones on the y-axis (relative to the original sample)
- `'pitch'`: plot scientific pitch strings (the Track should have a meaningul `basepitch`)
- `'names'`: plot note names in alphabetical order, not inferring pitch; useful for MultiSample tracks
timesig : int, optional
Sets the ticks/grid to a given frequency of beats. The default is 4.. The default is 4.
grid : bool, optional
Whether to include a grid. The default is True.
ax : matplotlib.axes.Axes, optional
Axes to create the plot on. The default is None.
scatter_kwds : dict, optional
Keyword arguments passed to `matplotlib.axes.Axes.scatter`.
The default is None.
plot_kwds : dict, optional
Keyword arguments passed to `matplotlib.axes.Axes.plot`.
The default is None.
Raises
------
WubWubError
`y-axis` value is not valid.
Returns
-------
matplotlib.figure.Figure
The Figure for the track plot.
Examples
--------
Example track plots for the `"hinote1"` track in the "Electro" example:
```python
seq['hinote1'].plot()
```
```python
seq['hinote1'].plot(yaxis='pitch')
```
'''
if yaxis not in ['pitch', 'semitones', 'names']:
raise WubWubError('yaxis must be "pitch", "semitones", or "names".')
if ax is None:
ax = plt.gca()
if grid:
ax.yaxis.grid(True, which='major', alpha=.3)
ax.xaxis.grid(True, which='major', alpha=.3)
ax.xaxis.grid(which='minor', alpha=.3)
ax.set_ylabel(yaxis)
ax.set_xlabel('beats')
if scatter_kwds is None:
scatter_kwds = {}
if plot_kwds is None:
plot_kwds = {}
pitchnums = set()
color = track.plotting.get('color')
marker = track.plotting.get('marker')
if not color:
color = 'blue'
if not marker:
marker = 'o'
beats = []
notes = []
lengths = []
for beat, element in track.notedict.items():
clss = element.__class__.__name__
if clss == "Note":
beats.append(beat)
notes.append(element)
lengths.append(_actual_soundlength(track, element))
else:
for note in element.notes:
beats.append(beat)
notes.append(note)
lengths.append(_actual_soundlength(track, element))
if yaxis in ['pitch', 'semitones']:
for b, n, l in zip(beats, notes, lengths):
p = _convert_semitones_str_yaxis(yaxis, n, track)
if isinstance(p, str):
p = relative_pitch_to_int('C1', p)
pitchnums.add(p)
ax.scatter(b, p, color=color, **scatter_kwds)
ax.plot([b, b+l], [p, p], color=color, **plot_kwds)
if yaxis == 'pitch':
_format_pitch_yaxis(ax, pitchnums)
elif yaxis == 'names':
labels = tuple(set(n.pitch for n in notes))
positions_dict = dict(zip(labels, range(len(labels))))
for b, n, l in zip(beats, notes, lengths):
p = positions_dict[n.pitch]
ax.scatter(b, p, color=color, **scatter_kwds)
ax.plot([b, b+l], [p, p], color=color, **plot_kwds)
ax.set_yticks(range(len(labels)))
ax.set_yticklabels(labels)
max_beats = track.get_beats() + 1
step = 1
xticks = range(1, max_beats+1, step)
c = 1
while len(xticks) > 10:
step = timesig * c
xticks = range(1, max_beats+1, step)
c += 1
ax.set_xticks(xticks)
minor_locator = AutoMinorLocator(2)
ax.xaxis.set_minor_locator(minor_locator)
return ax.figure
def draw_pianoroll(ax, lo, hi, notenames=True):
'''Draw the pianoroll on Axes.'''
lo_num = relative_pitch_to_int('C1', lo) - 2
hi_num = relative_pitch_to_int('C1', hi) + 2
num_notes = hi_num - lo_num
if 14 < num_notes < 20:
fontsize = 8
if num_notes >= 20:
notenames = False
else:
fontsize = 10
ax.set_xlim(0, 1)
ax.set_ylim(lo_num, hi_num+1)
black = [1, 3, 6, 8, 10]
for i in range(lo_num, hi_num+1):
facecolor = 'black' if i % 12 in black else 'white'
rect = mpl.patches.Rectangle((0, i), width=1, height=1, facecolor=facecolor,
edgecolor='black')
ax.add_patch(rect)
if notenames:
note = pitch_from_semitones('C1', i)
textcolor = {'white':'black', 'black':'white'}[facecolor]
ax.text(0.1, i + 0.5, note, color=textcolor, va='center', fontsize=fontsize)
def pianoroll(track, timesig=4, grid=True,):
'''
Create a plot showing the track notes against piano keys.
Parameters
----------
track : wubwub Track
Trakc to plot.
timesig : int, optional
Sets the ticks/grid to a given frequency of beats. The default is 4.. The default is 4.
grid : bool, optional
Whether to include a grid. The default is True.
Returns
-------
fig : matplotlib.figure.Figure
Pianoroll Figure with 2 Axes.
Examples
--------
Example pianoroll plot for the `"rhodes2"` track in the "LoFi" example:
```python
seq['rhodes2'].pianoroll()
```
'''
fig = plt.figure()
gs = fig.add_gridspec(1, 10)
plt.subplots_adjust(wspace=0)
ax0 = fig.add_subplot(gs[:, 1])
ax1 = fig.add_subplot(gs[:, 2:], sharey=ax0)
ax1.set_xlabel('beats')
ax0.set_ylabel('pitch')
beats = []
notes = []
lengths = []
for beat, element in track.notedict.items():
clss = element.__class__.__name__
if clss == "Note":
beats.append(beat)
notes.append(_convert_semitones_str_yaxis('pitch', element, track))
lengths.append(_actual_soundlength(track, element))
else:
for note in element.notes:
beats.append(beat)
notes.append(_convert_semitones_str_yaxis('pitch', note, track))
lengths.append(_actual_soundlength(track, element))
semitones = [relative_pitch_to_int('C1', n) for n in notes]
lo = notes[semitones.index(min(semitones))]
hi = notes[semitones.index(max(semitones))]
draw_pianoroll(ax0, lo, hi)
ax1.set_xlim(1, track.get_beats() + 1)
for b, n, l in zip(beats, semitones, lengths):
rect = mpl.patches.Rectangle((b, n), width=l, height=1, color='firebrick', alpha=.7)
ax1.add_patch(rect)
ax0.set_xticks([])
ax1.set_yticklabels([])
for tic in ax0.yaxis.get_major_ticks():
tic.tick1line.set_visible(False)
for tic in ax1.yaxis.get_major_ticks():
tic.tick1line.set_visible(False)
if grid:
ax1.set_yticks(range(min(semitones)-2, max(semitones)+3))
ax1.yaxis.grid(True, which='major', alpha=.3)
ax1.xaxis.grid(True, which='major', alpha=.3)
ax1.xaxis.grid(which='minor', alpha=.3)
return figFunctions
def pianoroll(track, timesig=4, grid=True)-
Create a plot showing the track notes against piano keys.
Parameters
track:wubwub Track- Trakc to plot.
timesig:int, optional- Sets the ticks/grid to a given frequency of beats. The default is 4.. The default is 4.
grid:bool, optional- Whether to include a grid. The default is True.
Returns
fig:matplotlib.figure.Figure- Pianoroll Figure with 2 Axes.
Examples
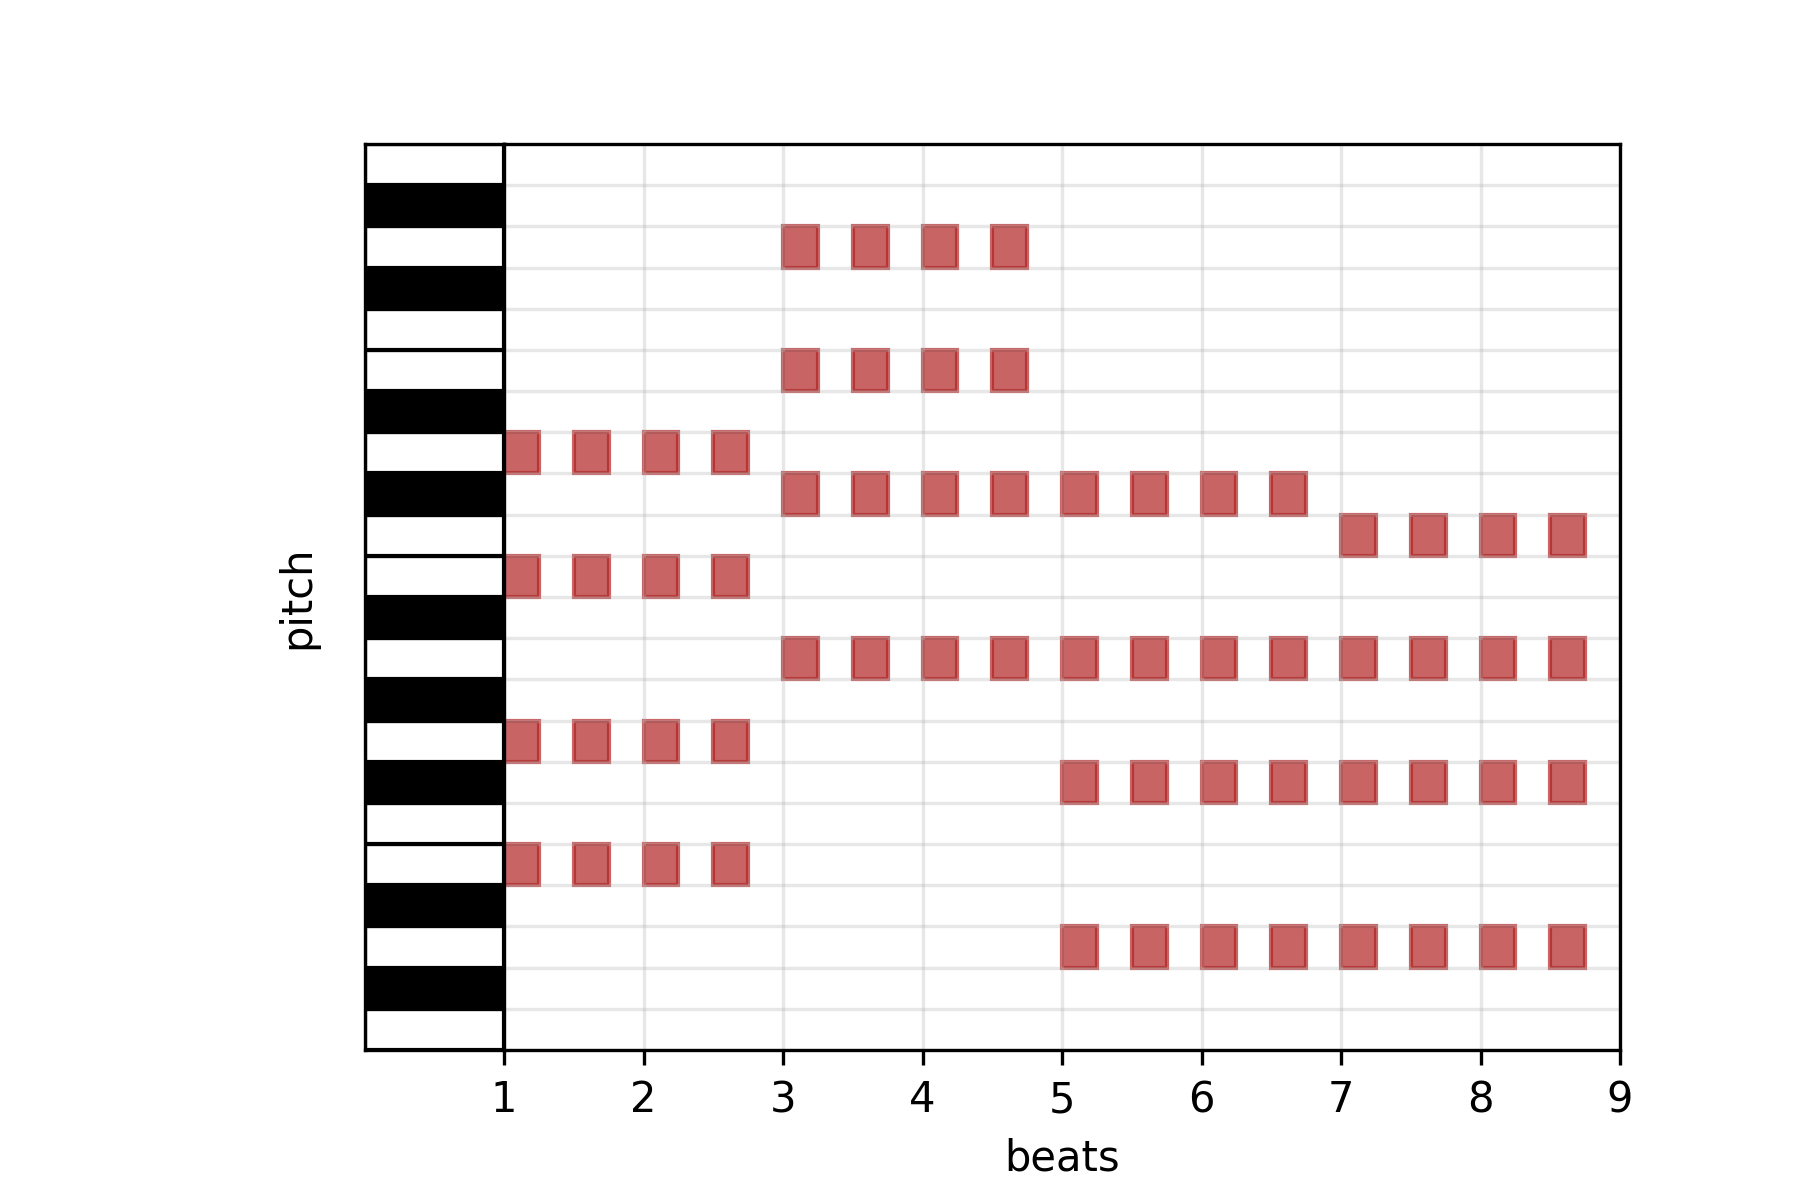
Example pianoroll plot for the
"rhodes2"track in the "LoFi" example:seq['rhodes2'].pianoroll()
Expand source code
def pianoroll(track, timesig=4, grid=True,): ''' Create a plot showing the track notes against piano keys. Parameters ---------- track : wubwub Track Trakc to plot. timesig : int, optional Sets the ticks/grid to a given frequency of beats. The default is 4.. The default is 4. grid : bool, optional Whether to include a grid. The default is True. Returns ------- fig : matplotlib.figure.Figure Pianoroll Figure with 2 Axes. Examples -------- Example pianoroll plot for the `"rhodes2"` track in the "LoFi" example: ```python seq['rhodes2'].pianoroll() ```  ''' fig = plt.figure() gs = fig.add_gridspec(1, 10) plt.subplots_adjust(wspace=0) ax0 = fig.add_subplot(gs[:, 1]) ax1 = fig.add_subplot(gs[:, 2:], sharey=ax0) ax1.set_xlabel('beats') ax0.set_ylabel('pitch') beats = [] notes = [] lengths = [] for beat, element in track.notedict.items(): clss = element.__class__.__name__ if clss == "Note": beats.append(beat) notes.append(_convert_semitones_str_yaxis('pitch', element, track)) lengths.append(_actual_soundlength(track, element)) else: for note in element.notes: beats.append(beat) notes.append(_convert_semitones_str_yaxis('pitch', note, track)) lengths.append(_actual_soundlength(track, element)) semitones = [relative_pitch_to_int('C1', n) for n in notes] lo = notes[semitones.index(min(semitones))] hi = notes[semitones.index(max(semitones))] draw_pianoroll(ax0, lo, hi) ax1.set_xlim(1, track.get_beats() + 1) for b, n, l in zip(beats, semitones, lengths): rect = mpl.patches.Rectangle((b, n), width=l, height=1, color='firebrick', alpha=.7) ax1.add_patch(rect) ax0.set_xticks([]) ax1.set_yticklabels([]) for tic in ax0.yaxis.get_major_ticks(): tic.tick1line.set_visible(False) for tic in ax1.yaxis.get_major_ticks(): tic.tick1line.set_visible(False) if grid: ax1.set_yticks(range(min(semitones)-2, max(semitones)+3)) ax1.yaxis.grid(True, which='major', alpha=.3) ax1.xaxis.grid(True, which='major', alpha=.3) ax1.xaxis.grid(which='minor', alpha=.3) return fig def sequencerplot(sequencer, timesig=4, grid=True, ax=None, scatter_kwds=None, plot_kwds=None)-
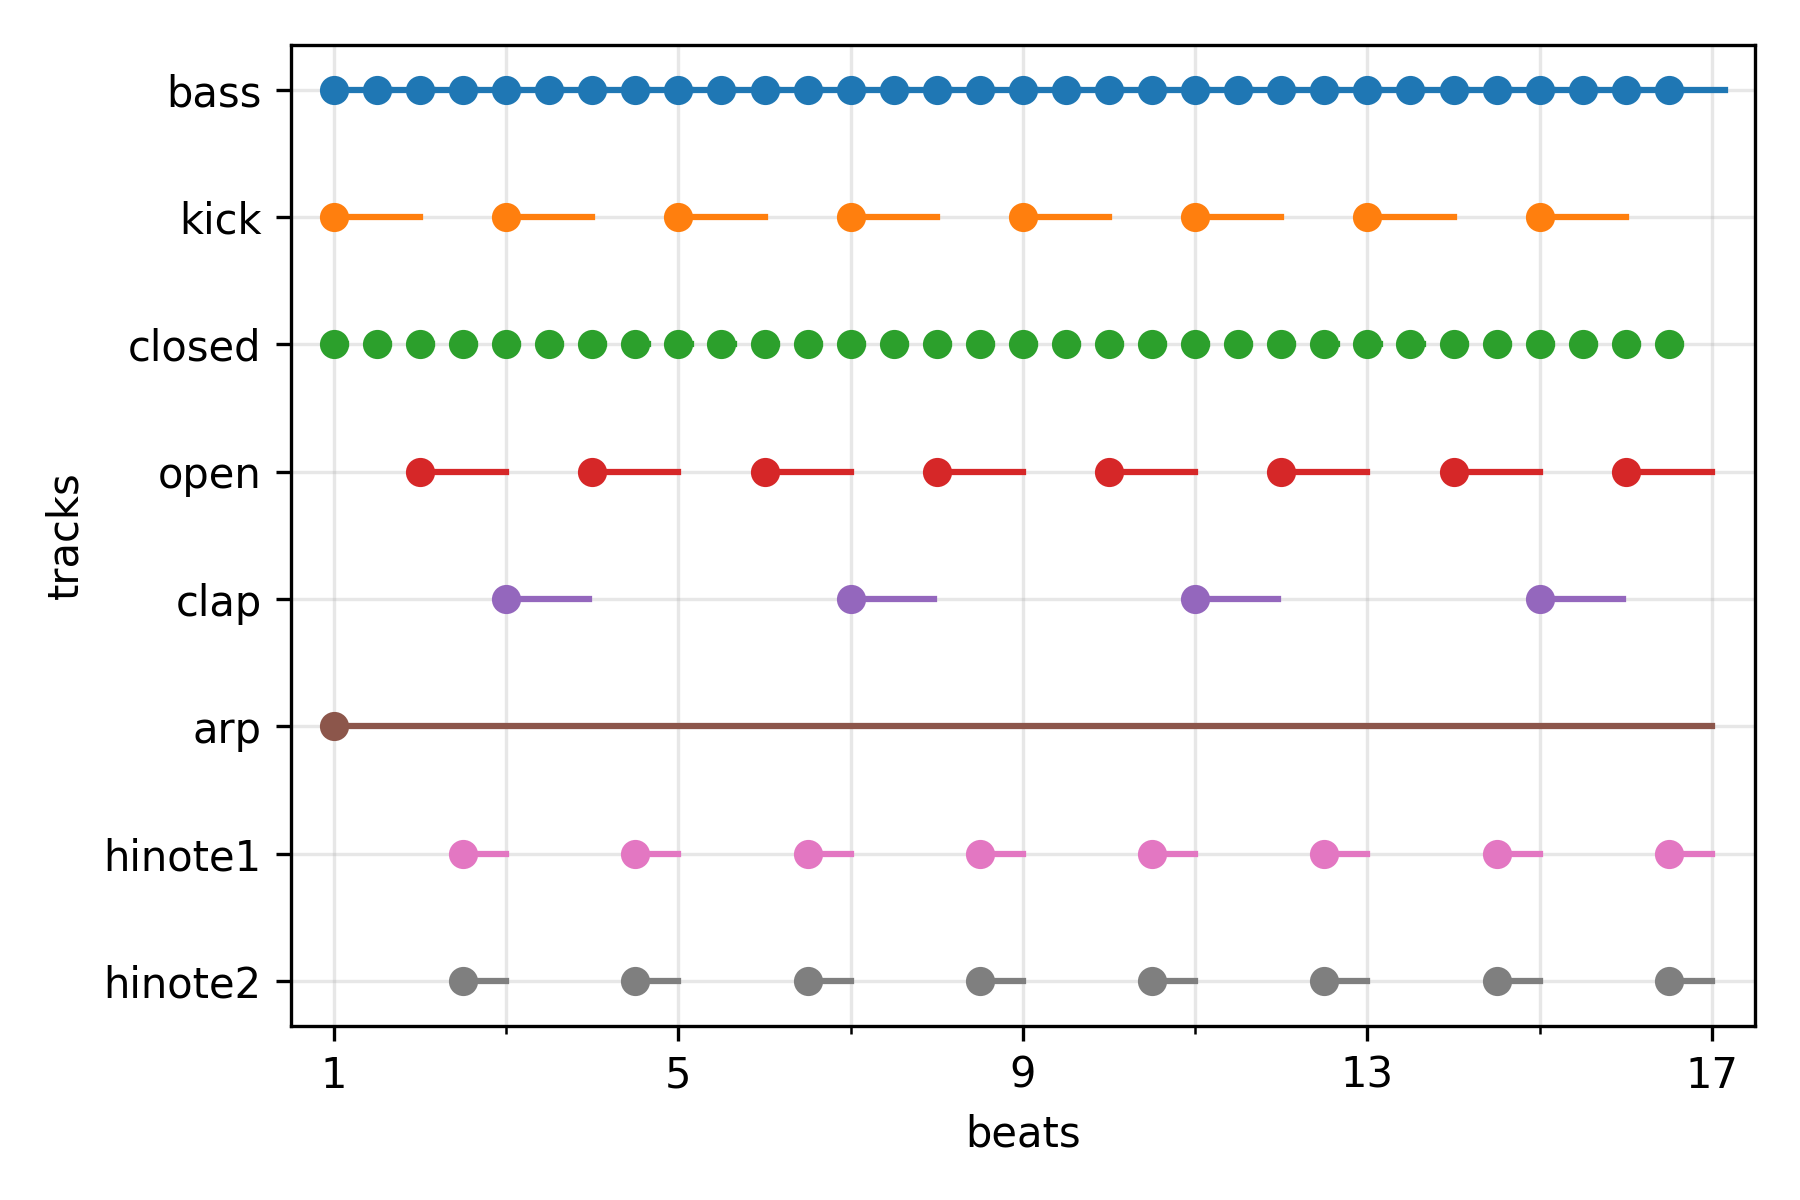
Create a plot showing beats on the x-axis, and Tracks on the y-axis. Plotted elements correspond to the start and length of each Note in each Track.
Parameters
sequencer:Sequencer- A Sequencer.
timesig:int, optional- Sets the ticks/grid to a given frequency of beats. The default is 4.
grid:bool, optional- Whether to include a grid. The default is True.
ax:matplotlib.axes.Axes, optional- Axes to create the plot on. The default is None.
scatter_kwds:dict, optional- Keyword arguments passed to
matplotlib.axes.Axes.scatter. The default is None. plot_kwds:dict, optional- Keyword arguments passed to
matplotlib.axes.Axes.plot. The default is None.
Returns
matplotlib.figure.Figure- The Figure containing the axes used.
Examples
Example sequencerplot for the "Electro" example:
seq.plot()
Expand source code
def sequencerplot(sequencer, timesig=4, grid=True, ax=None, scatter_kwds=None, plot_kwds=None): ''' Create a plot showing beats on the x-axis, and Tracks on the y-axis. Plotted elements correspond to the start and length of each Note in each Track. Parameters ---------- sequencer : wubwub.sequencer.Sequencer A Sequencer. timesig : int, optional Sets the ticks/grid to a given frequency of beats. The default is 4. grid : bool, optional Whether to include a grid. The default is True. ax : matplotlib.axes.Axes, optional Axes to create the plot on. The default is None. scatter_kwds : dict, optional Keyword arguments passed to `matplotlib.axes.Axes.scatter`. The default is None. plot_kwds : dict, optional Keyword arguments passed to `matplotlib.axes.Axes.plot`. The default is None. Returns ------- matplotlib.figure.Figure The Figure containing the axes used. Examples -------- Example sequencerplot for the "Electro" example: ``` seq.plot() ```  ''' if ax is None: ax = plt.gca() if scatter_kwds is None: scatter_kwds = {} if plot_kwds is None: plot_kwds = {} if grid: ax.yaxis.grid(True, which='major', alpha=.3) ax.xaxis.grid(True, which='major', alpha=.3) ax.xaxis.grid(which='minor', alpha=.3) ax.set_ylabel('tracks') ax.set_xlabel('beats') yticks = [] ylabs = [] c = 0 for y, track in enumerate(sequencer.tracks()): color = track.plotting.get('color') marker = track.plotting.get('marker') if not color: color = colors[c] c += 1 if not marker: marker = 'o' beats = track.array_of_beats() notes = track.notedict.values() ax.scatter(beats, [-y] * len(beats), color=color, marker=marker, zorder=5, **scatter_kwds) yticks.append(-y) ylabs.append(track.name) for b, n in zip(beats, notes): l = _actual_soundlength(track, n) ax.plot([b, b+l], [-y, -y], color=color, **plot_kwds) max_beats = sequencer.beats + 1 ax.set_yticks(yticks) ax.set_yticklabels(ylabs) beat_range = max_beats ax.set_xlim(0.5, beat_range + 0.5) step = 1 xticks = range(1, max_beats+1, step) c = 1 while len(xticks) > 10: step = timesig * c xticks = range(1, max_beats+1, step) c += 1 ax.set_xticks(xticks) minor_locator = AutoMinorLocator(2) ax.xaxis.set_minor_locator(minor_locator) return ax.figure def trackplot(track, yaxis='semitones', timesig=4, grid=True, ax=None, scatter_kwds=None, plot_kwds=None)-
Create a pitch vs. beat plot for one Track.
Parameters
track:wubwub Track- Any wubwub Track class.
yaxis:'semitones'or'pitch'or'names', optional- Determines how elements are plotted on the y-axis.
The default is 'semitones'.
-
'semitones': plot semitones on the y-axis (relative to the original sample) -'pitch': plot scientific pitch strings (the Track should have a meaningulbasepitch) -'names': plot note names in alphabetical order, not inferring pitch; useful for MultiSample tracks timesig:int, optional- Sets the ticks/grid to a given frequency of beats. The default is 4.. The default is 4.
grid:bool, optional- Whether to include a grid. The default is True.
ax:matplotlib.axes.Axes, optional- Axes to create the plot on. The default is None.
scatter_kwds:dict, optional- Keyword arguments passed to
matplotlib.axes.Axes.scatter. The default is None. plot_kwds:dict, optional- Keyword arguments passed to
matplotlib.axes.Axes.plot. The default is None.
Raises
WubWubErrory-axisvalue is not valid.
Returns
matplotlib.figure.Figure- The Figure for the track plot.
Examples
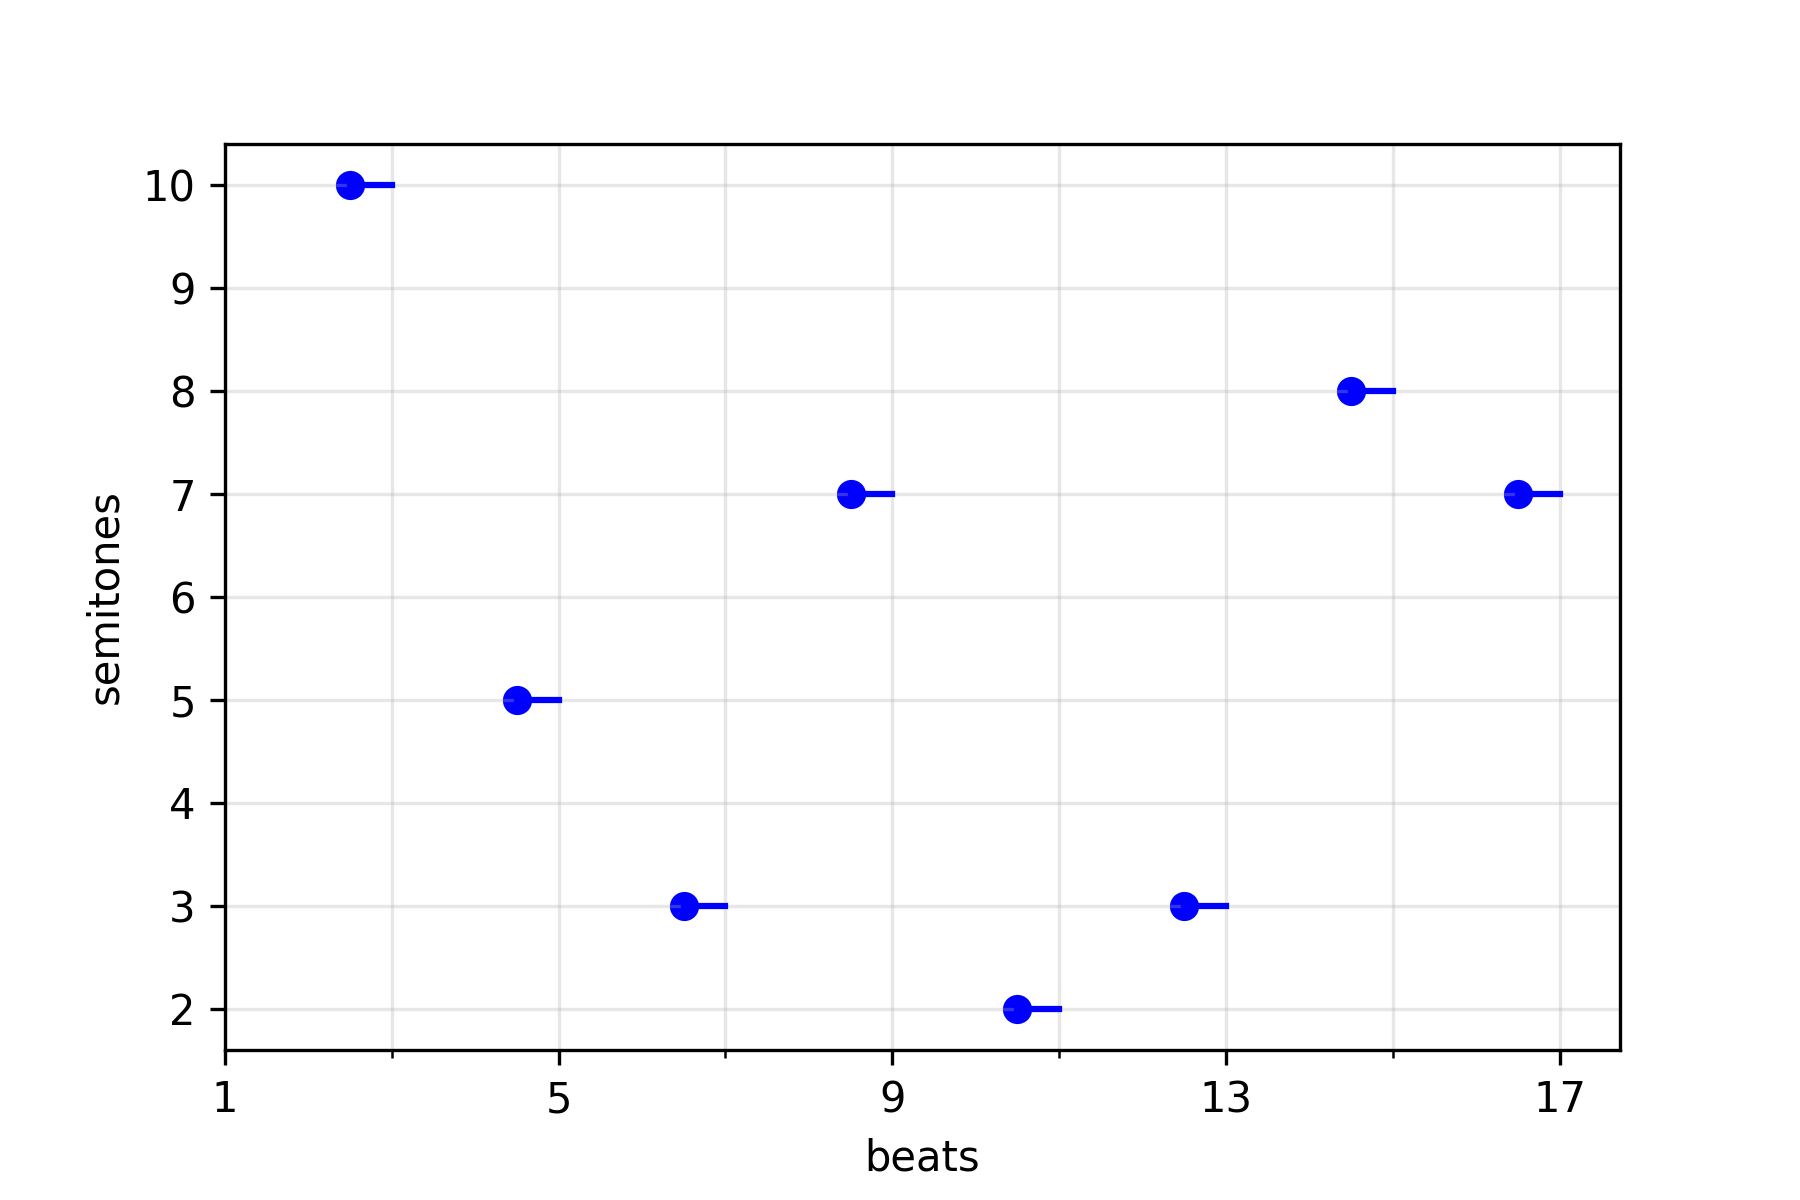
Example track plots for the
"hinote1"track in the "Electro" example:seq['hinote1'].plot()
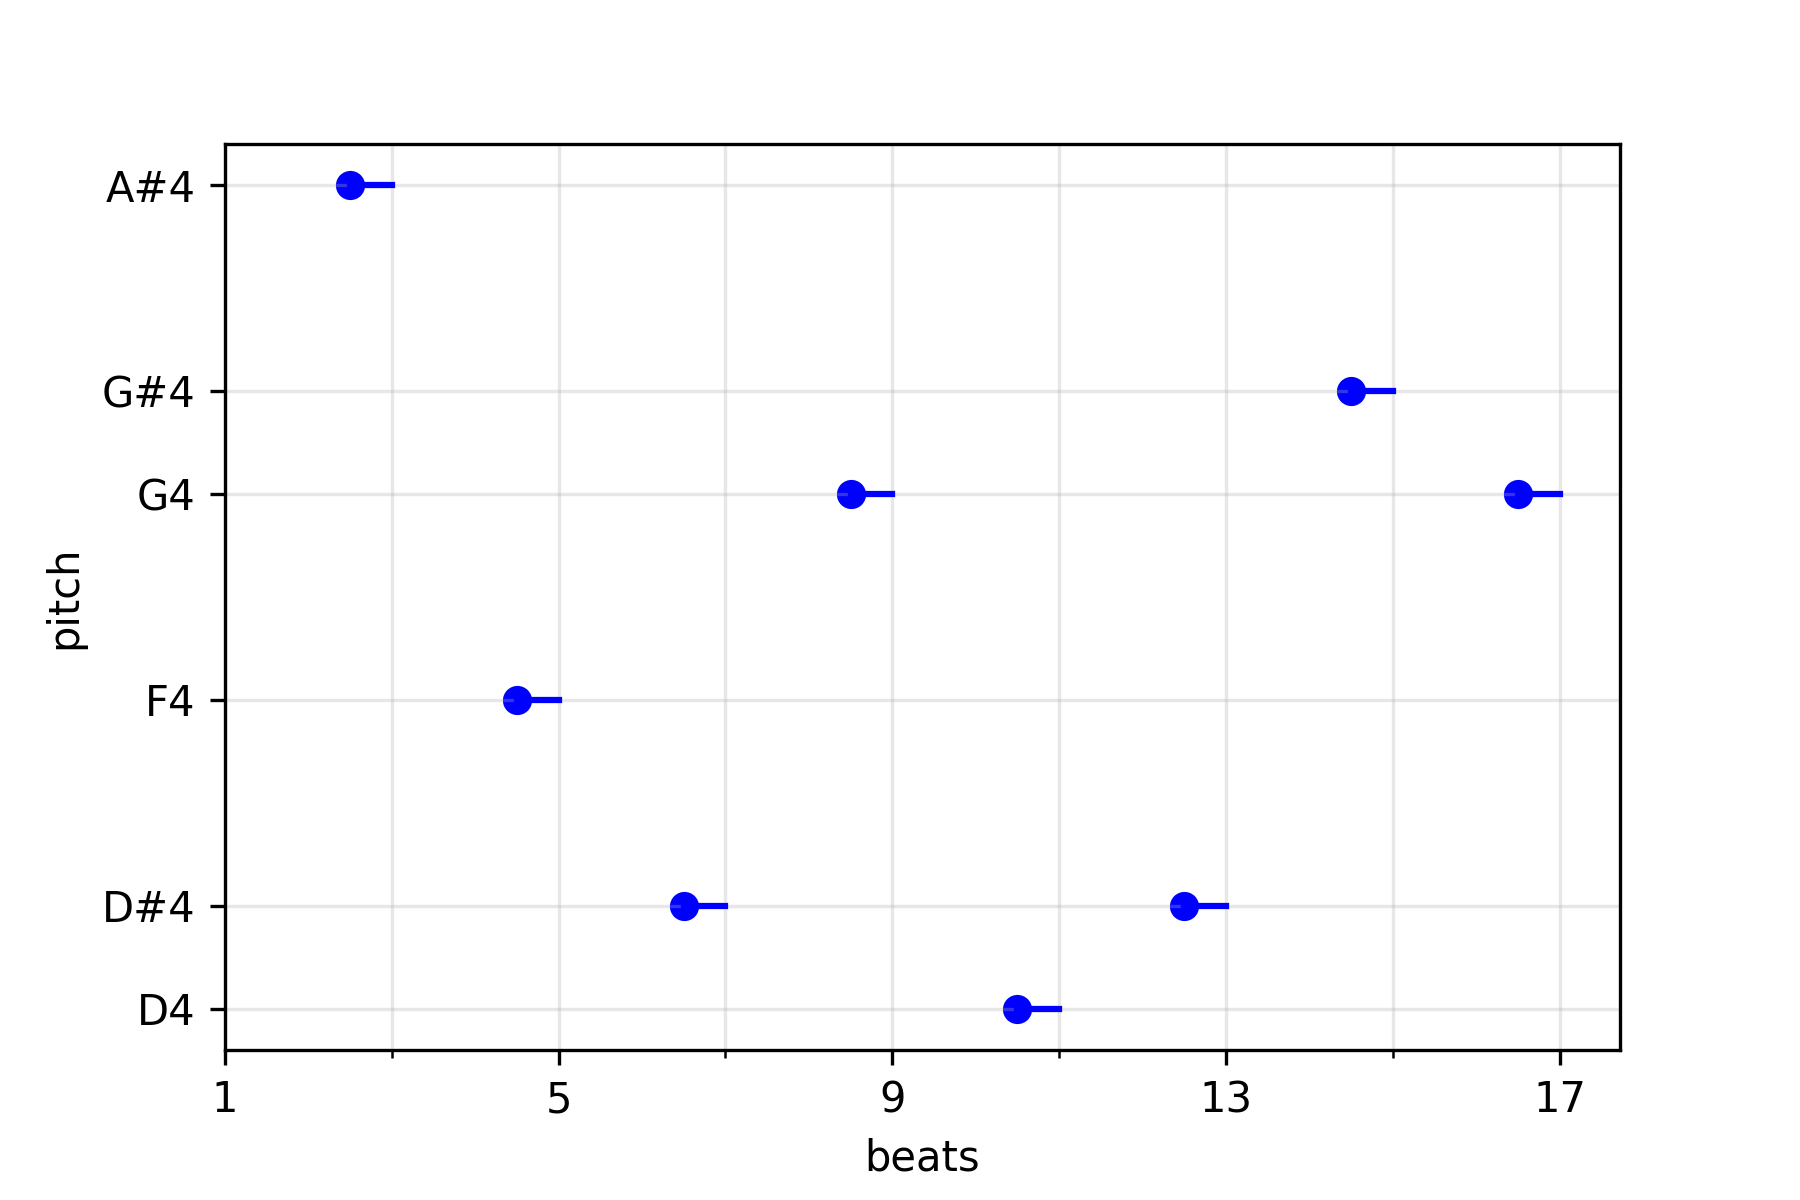
seq['hinote1'].plot(yaxis='pitch')
Expand source code
def trackplot(track, yaxis='semitones', timesig=4, grid=True, ax=None, scatter_kwds=None, plot_kwds=None): ''' Create a pitch vs. beat plot for one Track. Parameters ---------- track : wubwub Track Any wubwub Track class. yaxis : 'semitones' or 'pitch' or 'names', optional Determines how elements are plotted on the y-axis. The default is 'semitones'. - `'semitones'`: plot semitones on the y-axis (relative to the original sample) - `'pitch'`: plot scientific pitch strings (the Track should have a meaningul `basepitch`) - `'names'`: plot note names in alphabetical order, not inferring pitch; useful for MultiSample tracks timesig : int, optional Sets the ticks/grid to a given frequency of beats. The default is 4.. The default is 4. grid : bool, optional Whether to include a grid. The default is True. ax : matplotlib.axes.Axes, optional Axes to create the plot on. The default is None. scatter_kwds : dict, optional Keyword arguments passed to `matplotlib.axes.Axes.scatter`. The default is None. plot_kwds : dict, optional Keyword arguments passed to `matplotlib.axes.Axes.plot`. The default is None. Raises ------ WubWubError `y-axis` value is not valid. Returns ------- matplotlib.figure.Figure The Figure for the track plot. Examples -------- Example track plots for the `"hinote1"` track in the "Electro" example: ```python seq['hinote1'].plot() ```  ```python seq['hinote1'].plot(yaxis='pitch') ```  ''' if yaxis not in ['pitch', 'semitones', 'names']: raise WubWubError('yaxis must be "pitch", "semitones", or "names".') if ax is None: ax = plt.gca() if grid: ax.yaxis.grid(True, which='major', alpha=.3) ax.xaxis.grid(True, which='major', alpha=.3) ax.xaxis.grid(which='minor', alpha=.3) ax.set_ylabel(yaxis) ax.set_xlabel('beats') if scatter_kwds is None: scatter_kwds = {} if plot_kwds is None: plot_kwds = {} pitchnums = set() color = track.plotting.get('color') marker = track.plotting.get('marker') if not color: color = 'blue' if not marker: marker = 'o' beats = [] notes = [] lengths = [] for beat, element in track.notedict.items(): clss = element.__class__.__name__ if clss == "Note": beats.append(beat) notes.append(element) lengths.append(_actual_soundlength(track, element)) else: for note in element.notes: beats.append(beat) notes.append(note) lengths.append(_actual_soundlength(track, element)) if yaxis in ['pitch', 'semitones']: for b, n, l in zip(beats, notes, lengths): p = _convert_semitones_str_yaxis(yaxis, n, track) if isinstance(p, str): p = relative_pitch_to_int('C1', p) pitchnums.add(p) ax.scatter(b, p, color=color, **scatter_kwds) ax.plot([b, b+l], [p, p], color=color, **plot_kwds) if yaxis == 'pitch': _format_pitch_yaxis(ax, pitchnums) elif yaxis == 'names': labels = tuple(set(n.pitch for n in notes)) positions_dict = dict(zip(labels, range(len(labels)))) for b, n, l in zip(beats, notes, lengths): p = positions_dict[n.pitch] ax.scatter(b, p, color=color, **scatter_kwds) ax.plot([b, b+l], [p, p], color=color, **plot_kwds) ax.set_yticks(range(len(labels))) ax.set_yticklabels(labels) max_beats = track.get_beats() + 1 step = 1 xticks = range(1, max_beats+1, step) c = 1 while len(xticks) > 10: step = timesig * c xticks = range(1, max_beats+1, step) c += 1 ax.set_xticks(xticks) minor_locator = AutoMinorLocator(2) ax.xaxis.set_minor_locator(minor_locator) return ax.figure